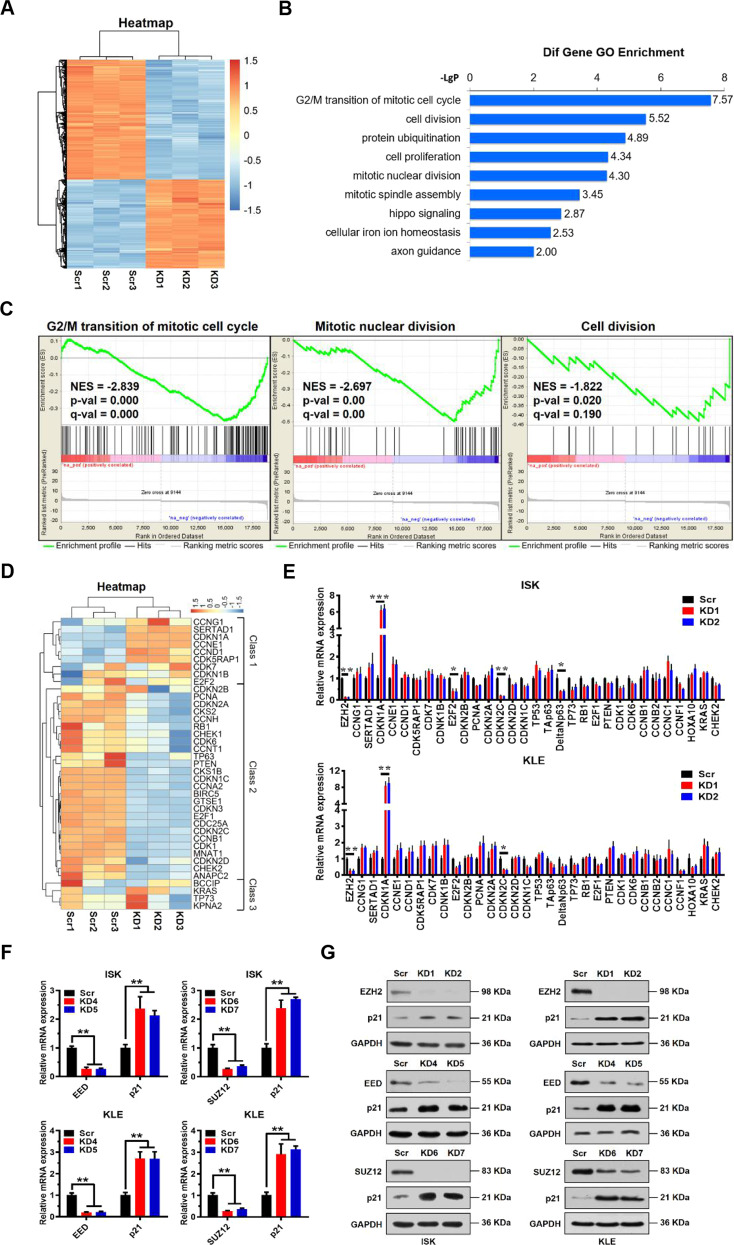
Fig. 2. Identification of p21 as an indirect target of EZH2.
A Hierarchical cluster analysis of all genes exhibiting differential expression in EZH2 knockdown (KD 1, 2, 3) or Scr control (Scr 1, 2, 3) ISK cells. B Significant biological processes of differentially expressed genes (both up and down) analyzed by Gene Ontology (GO) enrichment. The Y axis is the pathway category, and the X axis is the negative logarithm of the P value (−LgP). C Gene set enrichment analysis (GSEA) for G2/M transition, mitotic nuclear division, or cell division of ISK cells with or without EZH2 knockdown; n = 3 per group. D Hierarchical cluster analysis of key genes related to cell cycle regulation in EZH2 knockdown (KD) or Scr control ISK cells. E Relative mRNA expression levels of a panel of key genes involved in cell cycle regulation analyzed by quantitative real-time PCR in Scr control or EZH2 knockdown ISK and KLE cells. GAPDH was used as an endogenous control. Data shown are mean ± SD (n = 3). ***P < 0.001, **P < 0.01, and *P < 0.05 vs. Scr control. F Relative mRNA expression levels of p21 normalized to GAPDH analyzed by quantitative real-time PCR in Scr control, EED knockdown (KD 4, 5) or SUZ12 knockdown (KD 6, 7) ISK and KLE cells. Data shown are mean ± SD (n = 3). ***P < 0.001, **P < 0.01 and *P < 0.05 vs. Scr control. G Immunoblots of indicated proteins in Scr, EZH2 knockdown, EED knockdown, or SUZ12 knockdown ISK and KLE cells. GAPDH served as a loading control.

