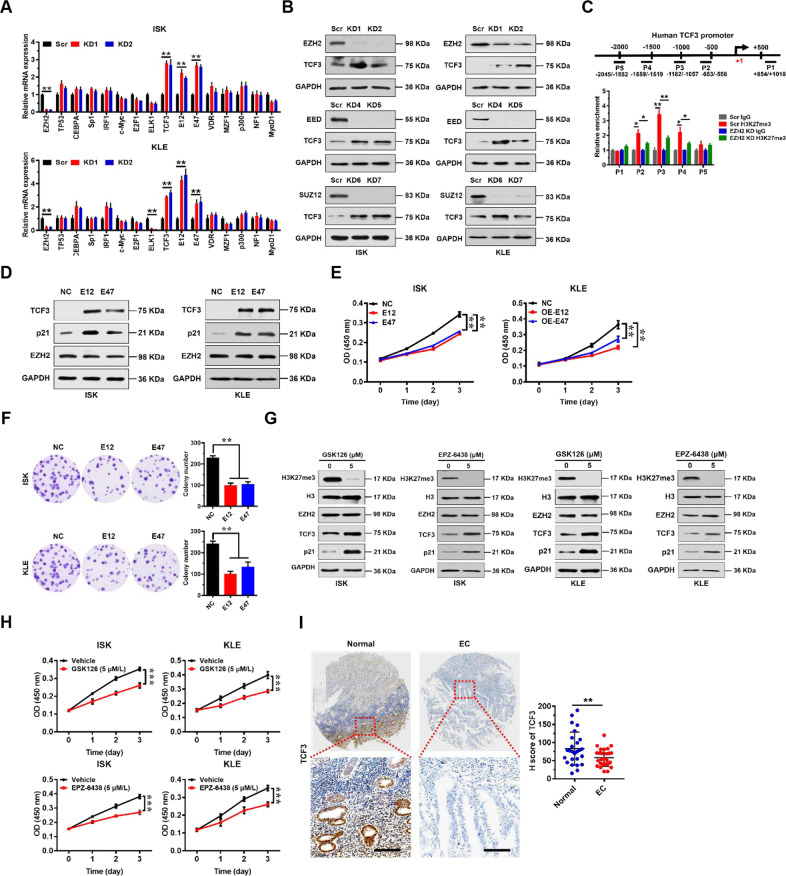
Fig. 3. EZH2 directly regulates TCF3 which regulates p21 transcription in EC cells.
A Relative mRNA expression levels of a panel of key transcription factors potentially regulating p21 normalized to GAPDH analyzed by quantitative real-time PCR in scrambled control (Scr) or EZH2 knockdown ISK and KLE cells. Data shown are mean ± SD (n = 3). **P < 0.01 compared with Scr control. B Immunoblots of EZH2 and TCF3 in Scr or PRC2 core subunit (EZH2, EED, and SUZ12) knockdown ISK and KLE cells. GAPDH served as a loading control. C Enrichment of H3K27me3 on TCF3 promoter in Scr or EZH2 knockdown ISK cells detected by ChIP-qPCR (bottom). Diagram shows positions of ChIP primers at the TCF3 promoter (top). Data shown are mean ± SD (n = 3). **P < 0.01, *P < 0.05 compared with indicated control. D Immunoblots of TCF3, p21, and EZH2 in negative control (NC, vector alone) or enforced expression of TCF3 variants (E12 or E47) in ISK and KLE cells. GAPDH served as a loading control. E, F Cellular proliferation were measured by CCK8 (E) and colony formation assay (F) after enforced expression TCF3 variants (E12 or E47) in ISK and KLE cells. **P < 0.01 vs. NC. G Effect of inhibition of EZH2 activity by GSK126 and EPZ-6438 on TCF3 and p21 protein levels in ISK (left) and KLE (right) cells. GAPDH served as a loading control. H Cell proliferation measured by CCK8 assay after GSK126 and EPZ-6438 treatment in ISK and KLE cells. **P < 0.01 vs. Vehicle treatment. I Immunohistochemical (IHC) staining of TCF3 protein in matched human normal and EC tissues (left). Representative micrographs are shown in original magnification (×400). Scale bars, 50 μm. Total IHC score of TCF3 in matched human normal and EC tissues (n = 26). ***P < 0.001 vs. Normal control (right).

