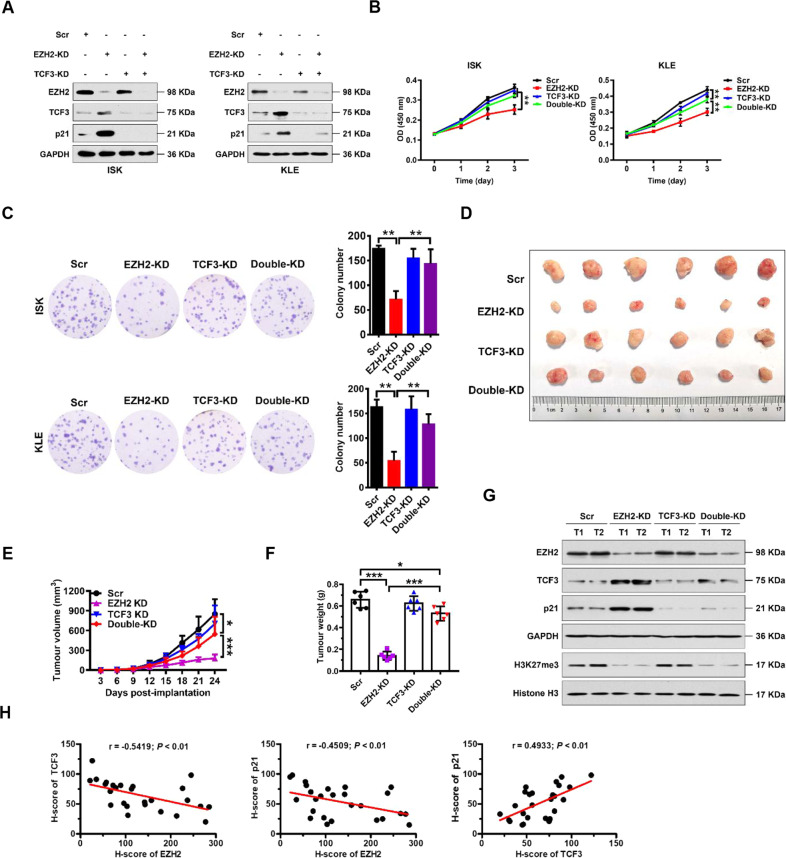
Fig. 4. EZH2 promotes proliferation of EC cells by directly repressing TCF3.
A Immunoblots of EZH2, TCF3, or p21 following knocking down of EZH2 or TCF3 individually or simultaneously in ISK (left) and KLE (right) cells. GAPDH was used as internal loading control. B, C Cellular proliferation measured by CCK8 (B) and colony formation (C) assays following knockdown of EZH2 or TCF3 individually or simultaneously in ISK and KLE cells (as indicated). **P < 0.01 vs. indicated control. D–F Photograph (D), tumor volumes (E), and tumor masses (F) of excised xenograft tumors from scrambled (Scr) control, EZH2-KD, TCF3-KD, and EZH2-KD + TCF3-KD groups. Data are presented as the means ± SD; ***P < 0.001, *P < 0.05 vs. indicated control. G Western blotting analysis of indicated proteins in excised xenograft tumors from Scr control, EZH2-KD, TCF3-KD, and EZH2-KD + TCF3-KD groups. GAPDH and histone H3 were used as endogenous loading controls. H Pearson correlation scatter plot of H scores (protein levels) of EZH2 and TCF3 (left) or p21 (middle), or H scores (protein levels) of TCF3 and p21 (right) in human EC (n = 26).

