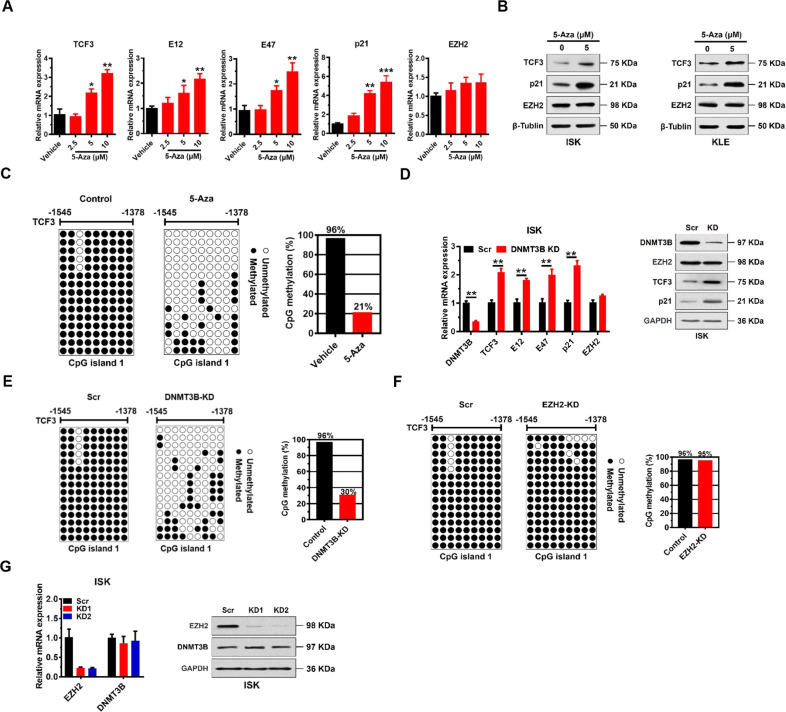
Fig. 5. DNMT3B mediates TCF3 promoter methylation independently of EZH2.
A Relative mRNA expression levels of indicated proteins normalized to GAPDH analyzed by quantitative real-time PCR in KLE cells treated with 5-Aza for 7 days. Data shown are mean ± SD (n = 3). *P < 0.05, **P < 0.01, ***P < 0.001 vs. vehicle treatment. B Immunoblots of TCF3, p21, and EZH2 in ISK and KLE lysates after 5 μM 5-Aza treatment for 7 days. β-Tubulin served as a loading control. C Bisulfite sequencing analysis of the TCF3 promoter (CpG island 1) in KLE cells treated with vehicle control or 5 μM 5-Aza for 4 days. D qRT-PCR (left) and immunoblots (right) of indicated proteins in ISK cells after DNMT3B knockdown. **P < 0.01 vs. Scr control. E Bisulfite sequencing analysis of the TCF3 promoter (CpG island 1) in ISK cells after DNMT3B knockdown. Each row shows the methylation status of individual CpG dinucleotides derived from sequence analysis of 15 representative individual cloned polymerase chain reaction (PCR) products of CpG island 1 after bisulfite modification. The numbers at the top represent the positions of the CpG dinucleotides relative to the transcriptional start site (TSS) of the TCF3 gene. F Bisulfite sequencing analysis of the TCF3 promoter (CpG island 1) in ISK cells after EZH2 knockdown as in (E). G qRT-PCR (left) and immunoblot (right) analysis showing DNMT3B mRNA and protein levels in ISK cells after EZH2 knockdown. GAPDH was used as a loading control.

