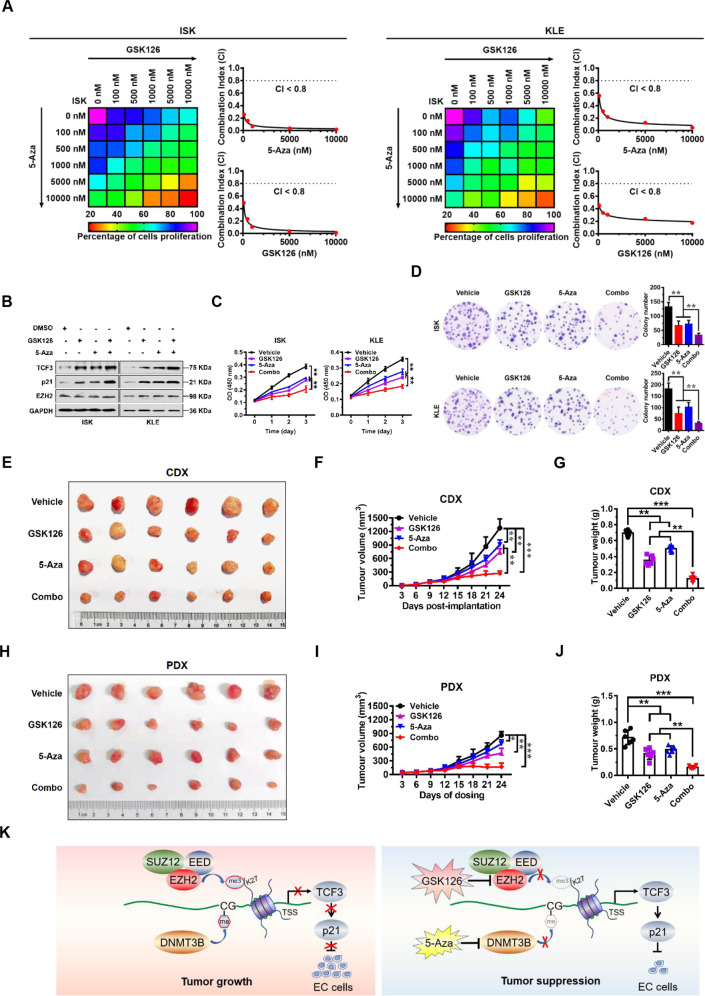
Fig. 6. Synergistic effect of combined treatment with GSK126 and 5-Aza in human EC.
A Drug dose-response matrix for growth inhibition of ISK (left) and KLE (right) cells following 7-day culture with GSK126 plus 5-Aza. Color gradation indicates percentage viability at the indicated dose combination. Combination index (CI) plots for 5 μM 5-Aza (top) or GSK126 (bottom) with graded doses of 5-Aza or GSK126 in ISK and KLE cells. B Immunoblots of TCF3, p21, and EZH2 protein in ISK (left) and KLE (right) cells following treatment with GSK126 (5 μM) or 5-Aza (5 μM), or combination for 7 days. GAPDH was used as a loading control. C, D CCK8 (C) and colony formation (D) assay were performed to evaluate the effect of the combination treatment with GSK126 and 5-Aza on cell proliferation of ISK and KLE cells. **P < 0.01 vs. indicated control. E–G Photograph (E), tumor volumes (F), and tumor masses (G) of ISK cell-derived xenograft tumors excised from mice treated with GSK126 (100 mg/kg) or 5-Aza (2.5 mg/kg) or combination. Data are presented as the means ± SD; **P < 0.01, ***P < 0.001 vs. indicated control. H–J Photograph (H), tumor volumes (I), and tumor masses (J) of patient-derived xenograft tumors excised from mice treated with GSK126 (100 mg/kg) or 5-Aza (2.5 mg/kg) or combination. Data are presented as the means ± SD; *P < 0.05, **P < 0.01, ***P < 0.001 vs. vehicle control. K Model of EC progression driven by PRC2 complex (EZH2, EED, and SUZ12) and DNMT3B. PRC2 complex and DNMT3B epigenetically repress transcription of TCF3 and p21, and promote EC cell proliferation (left). Inhibition of EZH2 and DNMT3B by GSK126 and 5-Aza de-represses TCF3 and p21 expression, and blocks EC tumor growth (right).

