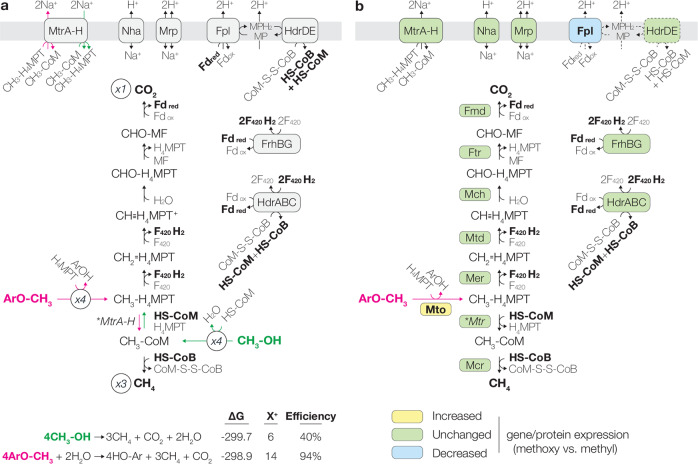
Fig. 5. Comparison of CH3-CoM- and hypothetical CH3-H4MPT-disproportionating methanogenesis based on (a) energetics and (b) expression.
a Reactions and reaction directions unique to MeOH (green) or 2-methoxybenzoate (pink) decomposition are shown. Below are the estimated Gibbs free energy (∆G) and the predicted energy yield (in terms of H+/Na+ extruded across the membrane, assuming the typical scheme of methylotrophic methanogenesis is followed) and thermodynamic efficiency of the shown methanogenesis pathways. ∆G was calculated assuming 60 °C, pH 7, 0.2 atm CO2, 0.2 atm CH4, 1 mM NH4+, and 10 mM for all other compounds. b Comparison of gene/protein expression of M. shengliensis grown on methoxylated aromatic compounds and methylated compounds. Yellow: genes/proteins for which both strains showed significantly increased expression during methoxydotrophic methanogenesis. Green: genes/proteins for which either (i) expression levels were not significantly different for both strains or (ii) consistent trends were not observed in both strains. Blue: genes/proteins for which both strains showed significantly decreased expression during methoxydotrophic methanogenesis. Arrows involving Fpl and HdrDE are dotted as Fpl was downregulated during methoxydotrophic methanogenesis and, with decreased Fpl activity, HdrDE’s activity would consequently decrease as well. H4MPT tetrahydromethanopterin, MF methanofuran.

