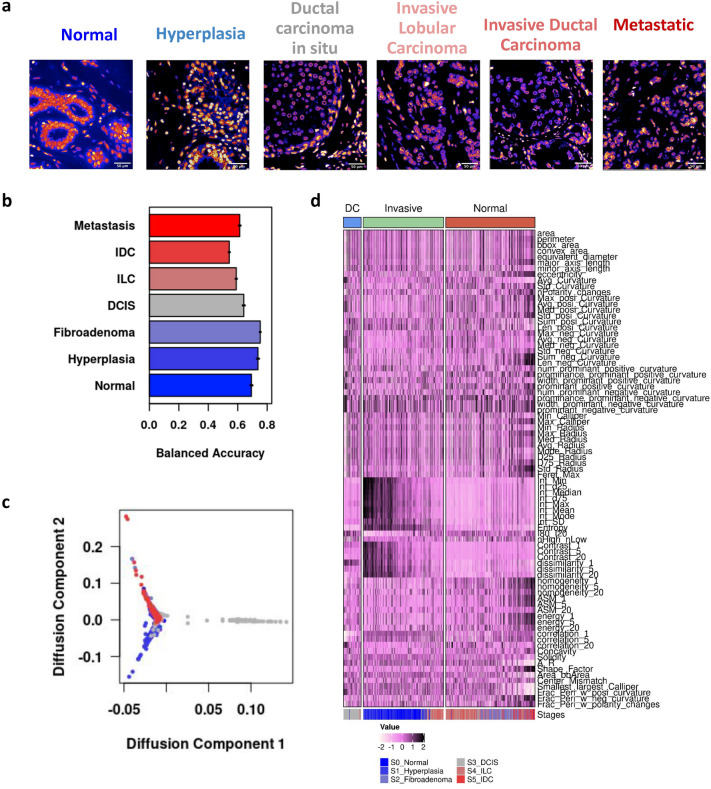
Figure 3.
Building a trajectory of chromatin reorganization associated with breast cancer progression. (a) Representative crops of Hoescht -stained tissue biopsy images of different stages of breast cancer. (b) Prediction accuracy of the linear discriminant classifier on the test dataset. Error bars denote the standard error of classification in across 5 cross validation tests. (c) Diffusion Map of nuclei from various stages of cancer. Each dot represents one cell and the color code is displayed as an inset. (d) Heatmap depicting the branch-wise changes to representative nuclear morphology and chromatin organization features. The color code is indicated near the bottom. Note that each column represents a single cell. The column-side color bar at the bottom of the heatmap represents the stage of cancer.

