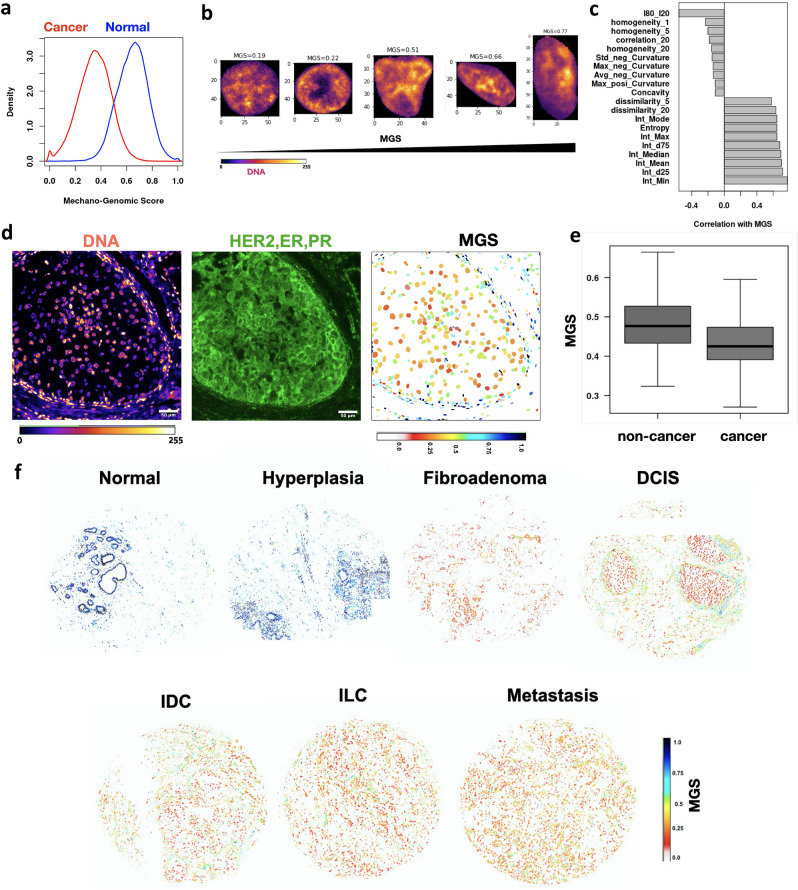
Figure 4.
Single cell Mechano-Genomic Score that reflects breast cancer progression. (a) Probability density histograms of Mechano-Genomic Score (MGS) for nuclei from normal tissues (blue) and invasive cancer tissues (red) (Wilcoxon Rank Sum Test p-value < 0.001). (b) Representative images of nuclei stained for DNA (fire colors) with increasing MGS values (the top margin). (c) The top 10 features with the highest or lowest pearson correlation coefficients with MGS. Please note that the number following the features refers to the length scale of the GLCM texture features. (d) Micrograph of DCIS tissue sections stained for DNA and Biomarker (HER, ER and PR cocktail). Each nuclear boundary is colored based on the MGS of the corresponding nucleus. The color code is on the bottom right. (e) MGS of nuclei within and outside the cancer regions. Wilcox Test p-value < 0.0001 for E and F. n ~ 800. (f) Visualizing the MGS at single cell resolution for representative TMA of varying breast cancer stages. Each nucleus is colored based on its MGS. The color code is on the bottom right.

