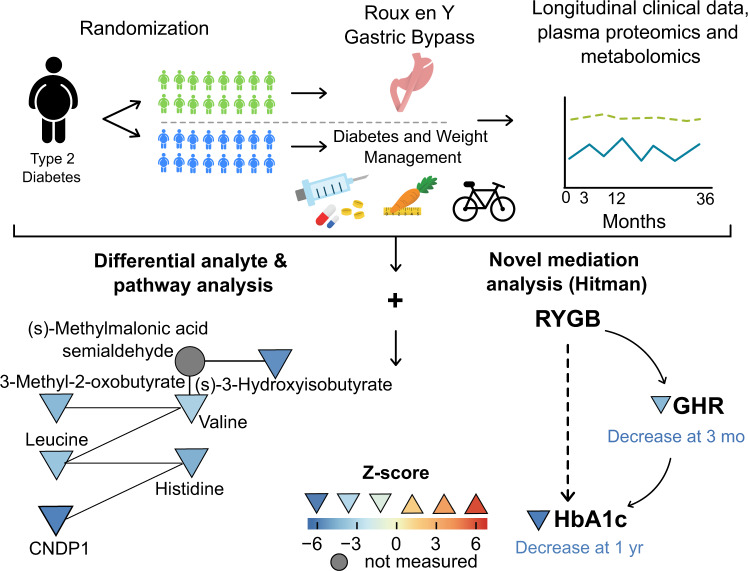
Fig. 1. Graphical overview shows study flow including clinical study schematic (top) and analysis (bottom).
Differential analyte and pathway analysis (bottom left) identified a network composed of top analytes from Valine, Leucine, and Isoleucine Degradation and Beta-Alanine Metabolism. Mediation analysis (bottom right) identified GHR as mediator of decrease in HbA1c. Triangles denote measured proteins or metabolites, while circles denote proteins or metabolites in the pathway not measured; symbols are colored according to between-group Z scores, using heat map indicated, with the orientation of triangle also indicating up- or downregulation, respectively. Source data are provided as a Source Data file.

