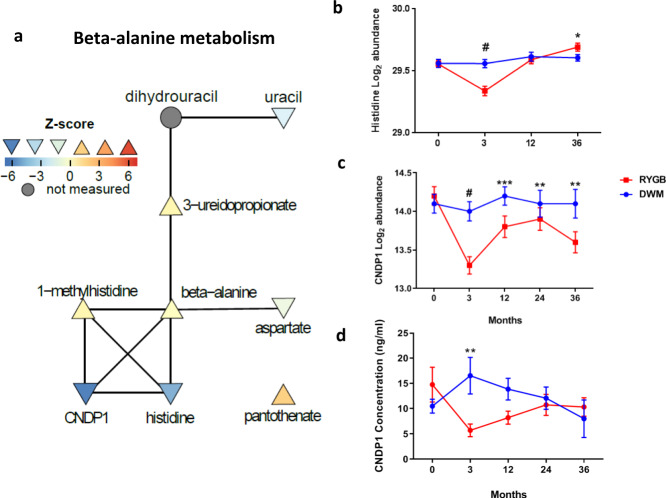
Fig. 5. Beta-alanine metabolism.
a Network nodes are colored by between-group z-score, whereas unmeasured nodes are colored gray. Orientation of triangle also indicates the directionality of regulation. Connections are from the Pathway Commons network. b Log2 abundance of histidine measured by metabolomics in samples from independent human participants at baseline, 3, 12, and 36 months from 19, 18, 16, and 9 DWM and 19, 18, 19, and 13 RYGB participants. c Log2 abundance of CNDP1 measured by SOMAscan, measured in samples from independent human participants at baseline, 3, 12, 24, and 36 months from 19, 19, 16, 10, and 9 DWM and 19, 19,19, 15, and 14 RYGB participants. d CNDP1 plasma levels measured by ELISA at baseline, 3, 12, 24, and 36 months from 10, 10, 10, 6, and 4 DWM participants and 10, 10, 9, 5, and 6 RYGB participants, respectively. Data were analyzed by two-sided moderated t-tests; post-baseline time points were analyzed using change from baseline. Data in b−d are reported as mean ± SEM. Nominal p-values are as follows: b histidine: 3 mo: #<0.0001, 36 mo: *=0.019; c CNDP1 (SOMAscan): 3 mo: #<0.0001, 12 mo: ***=0.00014; 24 mo: **=0.0054; 36 mo: **=0.0067; d CNDP1 ELISA: 3 mo: **=0.0036. Supplementary Data 2 includes FDRs and source data for (b/c); source data for d is provided as a Source Data file.

