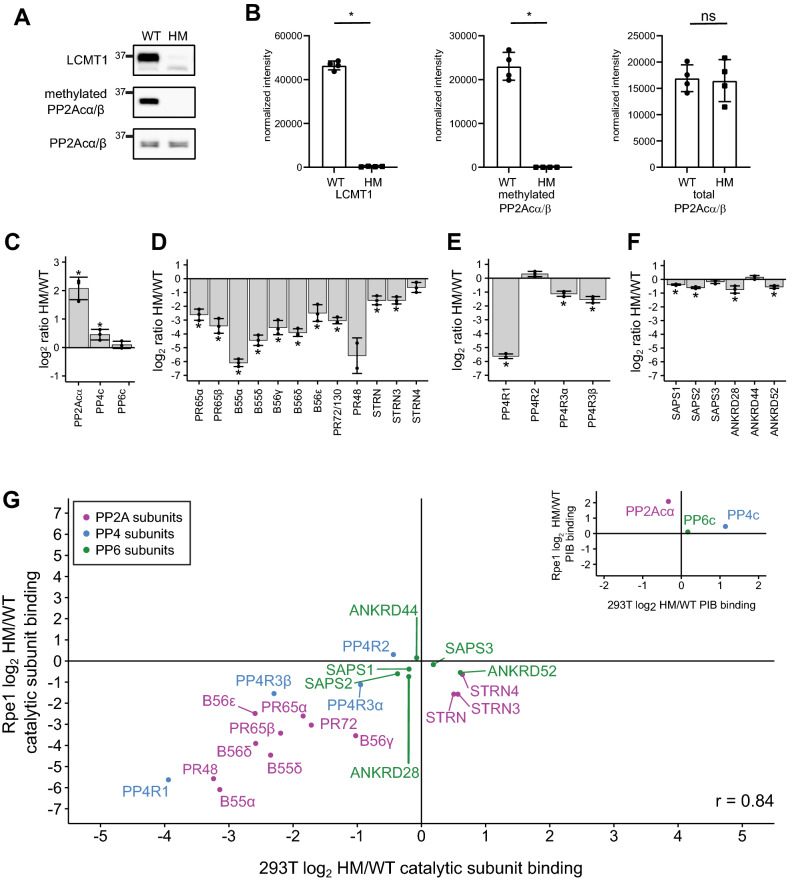
Figure 6.
The effects of disrupting LCMT1 expression in Rpe1 cells on the holoenzyme composition of PP2A, PP4, and PP6. (A) Western blots of wild-type (WT) and hypomorph (HM) Rpe1 cells probed for LCMT1, methylated PP2Acα/β, and total PP2Acα/β (B) Western blots were quantified and correct for loading based on total protein, and individual data points are shown for LCMT1, methylated PP2Acα/β, and total PP2Acα/β. Error bars represent the standard deviation of four replicates. The log2 HM/WT ratio of the abundance of the catalytic subunits (C), PP2A subunits (D), PP4 subunits (E), and PP6 subunits (F) bound to the PIBs as determined by proteomics analysis. (G) Scatterplot of the log2 HM/WT ratio of PP2A, PP4, and PP6 subunits binding to PIBs and normalized to the respective catalytic subunit from HEK293T cells versus Rpe1 cells. PP2A subunits are labeled in purple, PP4 subunits are in blue, and PP6 subunits are in green. The scatterplot in the upper right depicts catalytic subunit PIB binding HEK293T cells versus Rpe1 cells. *p < 0.05.

