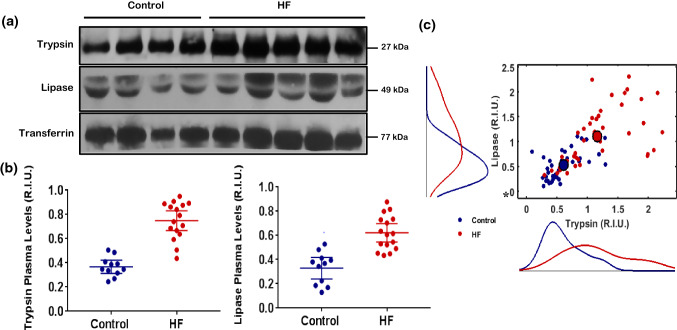
Figure 1.
(a) Cohort 1. Representative western blots for trypsin (top row) and lipase (middle row) levels in blood plasma of Controls (lanes 1–4) and from HF patients (lanes 5–9). The bottom row shows Transferrin controls. (b) Cohort 2. Mean values and corresponding 95% CI of pancreatic trypsin and pancreatic lipase levels, detected via Westerns, in blood plasma of the Control (blue) and HF patient group (red). On average, (a) the trypsin level of the HF patient group was higher (p < 0.0001, t-test) and (b) the lipase level of the HF patient group was higher (p < 0.0001, t-test) compared to controls. The 2D-Scatterplot in panel C shows the variation of lipase vs. trypsin for the control (blue) and the HF (red) group along with the marginal distributions for lipase (left) and trypsin (bottom). Compared to the marginal distribution of the control group, the marginal distribution of the HF group was different for both trypsin (p < 0.0001, KS-test) and lipase (p < 0.0001, KS-test). The Scatterplot in panel c also indicates that, on average, compared to the control group, the elevation of trypsin in the HF group was accompanied by elevation of lipase, as the mean of the control group (large blue point) was statistically different from the mean of the HF group (large red point) (p < 0.0001, Hotelling T2-test).

