Figure 1.
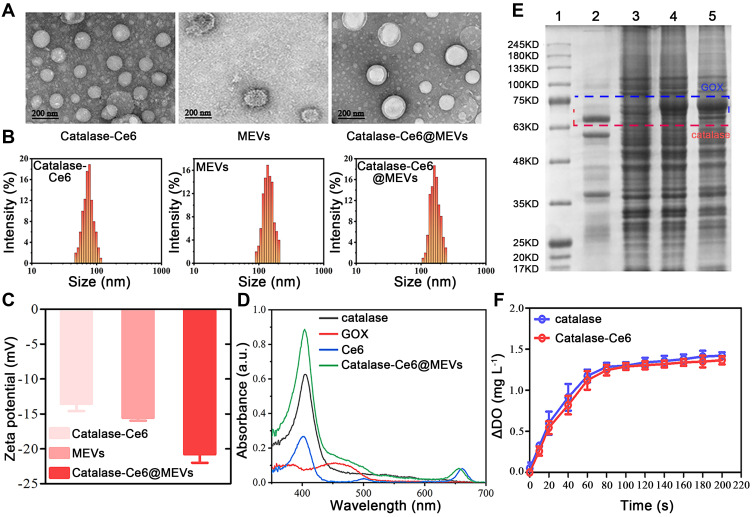
Synthesis and characterization of Catalase-Ce6@MEVs. (A) Transmission electron microscope (TEM) image of Catalase-Ce6, MEVs and Catalase-Ce6@MEVs. Scan bar, 200 nm. Particle size distributions (B) and Zeta potentials (C) of different formulations. (D) UV-vis spectra of catalase, GOX, Ce6 and Catalase-Ce6@MEVs. (E) SDS-PAGE pattern of proteins from (1) marker, (2) catalase, (3) EVs, (4) MEVs and (5) Catalase-Ce6@MEVs. The blue and red dotted lines indicated GOX and catalase respectively. (F) O2 concentration detection over time when catalase or Catalase-Ce6 was incubated with H2O2 solution (H2O2=1 mM, catalase=0.3 mg mL−1).

