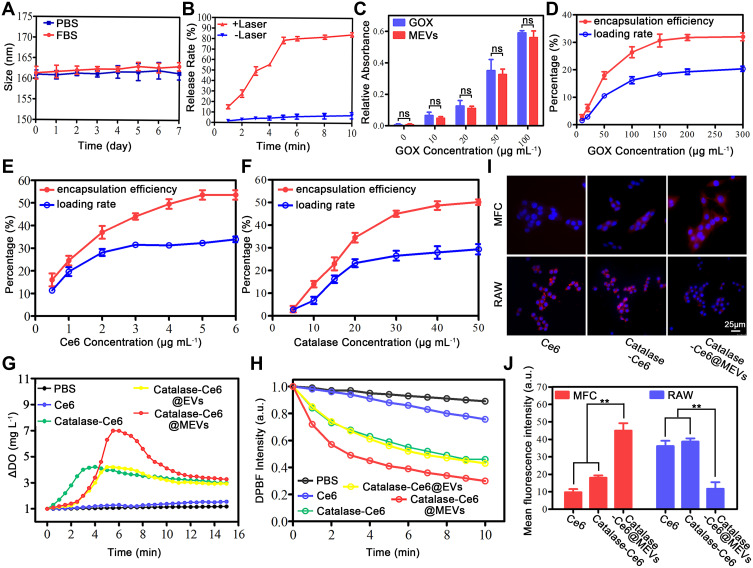
Figure 2.
In vitro performances of Catalase-Ce6@MEVs. (A) The stability of Catalase-Ce6@MEVs in PBS or FBS during 7 days. (B) The rate of released Catalase-Ce6 of Catalase-Ce6@MEVs under laser irradiation (660 nm, 0.08 W/cm2, 10 min) or not. (C) The glucose catalytic activity of pure GOX and MEVs with increasing concentration of GOX (glucose =2 mM). The encapsulation efficiency and loading rate of GOX (D), Ce6 (E) and catalase (F). (G) O2 concentration detection over time when different formulations were incubated with reaction mixture (glucose=2 mM, H2O2=1 mM). (H) Time-dependent degradation of DPBF when incubating with different formulations under laser irradiation. (I) Cellular uptake of Ce6, Catalase-Ce6 or Catalase-Ce6@MEVs. Scan bar, 25 μm. (J) The quantification analyses of the cellular uptake of Ce6, Catalase-Ce6 and Catalase-Ce6@MEVs. Data are presented as mean ± SD, statistical significance of (C and J) were analyzed via T-test with two-tails and one-way ANOVA respectively. ns = P ≥ 0.05, **P < 0.01.

