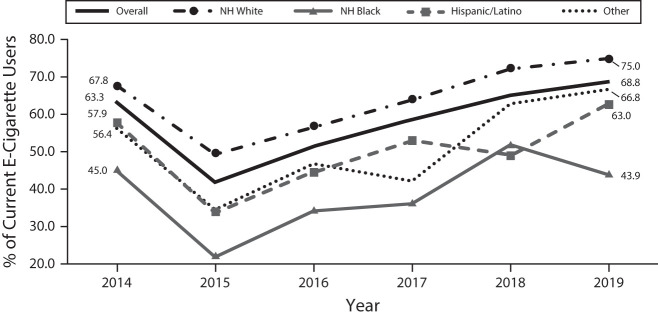
FIGURE 3—
Trends in Flavored E-Cigarette Use Among Current E-Cigarette Users: United States, 2014–2019
Note. NH = non-Hispanic. The y-axis shows the observed % of flavored e-cigarette use among current e-cigarette users. Multivariable regression models adjusted for age, gender, current cigarette smoking, current other tobacco use, tobacco use by a household member, and the number of days using e-cigarettes in the past 30 days. The interaction term of year × race/ethnicity: P = .56. Overall: quadratic trend, P < .001. NH White: quadratic trend, P < .001. NH Black: linear trend, adjusted odds ratio = 1.12; 95% confidence interval = 1.03, 1.22; P = .01; quadratic trend, P = .11. Hispanic/Latino: quadratic trend, P < .001. NH other: quadratic trend, P = .004.

