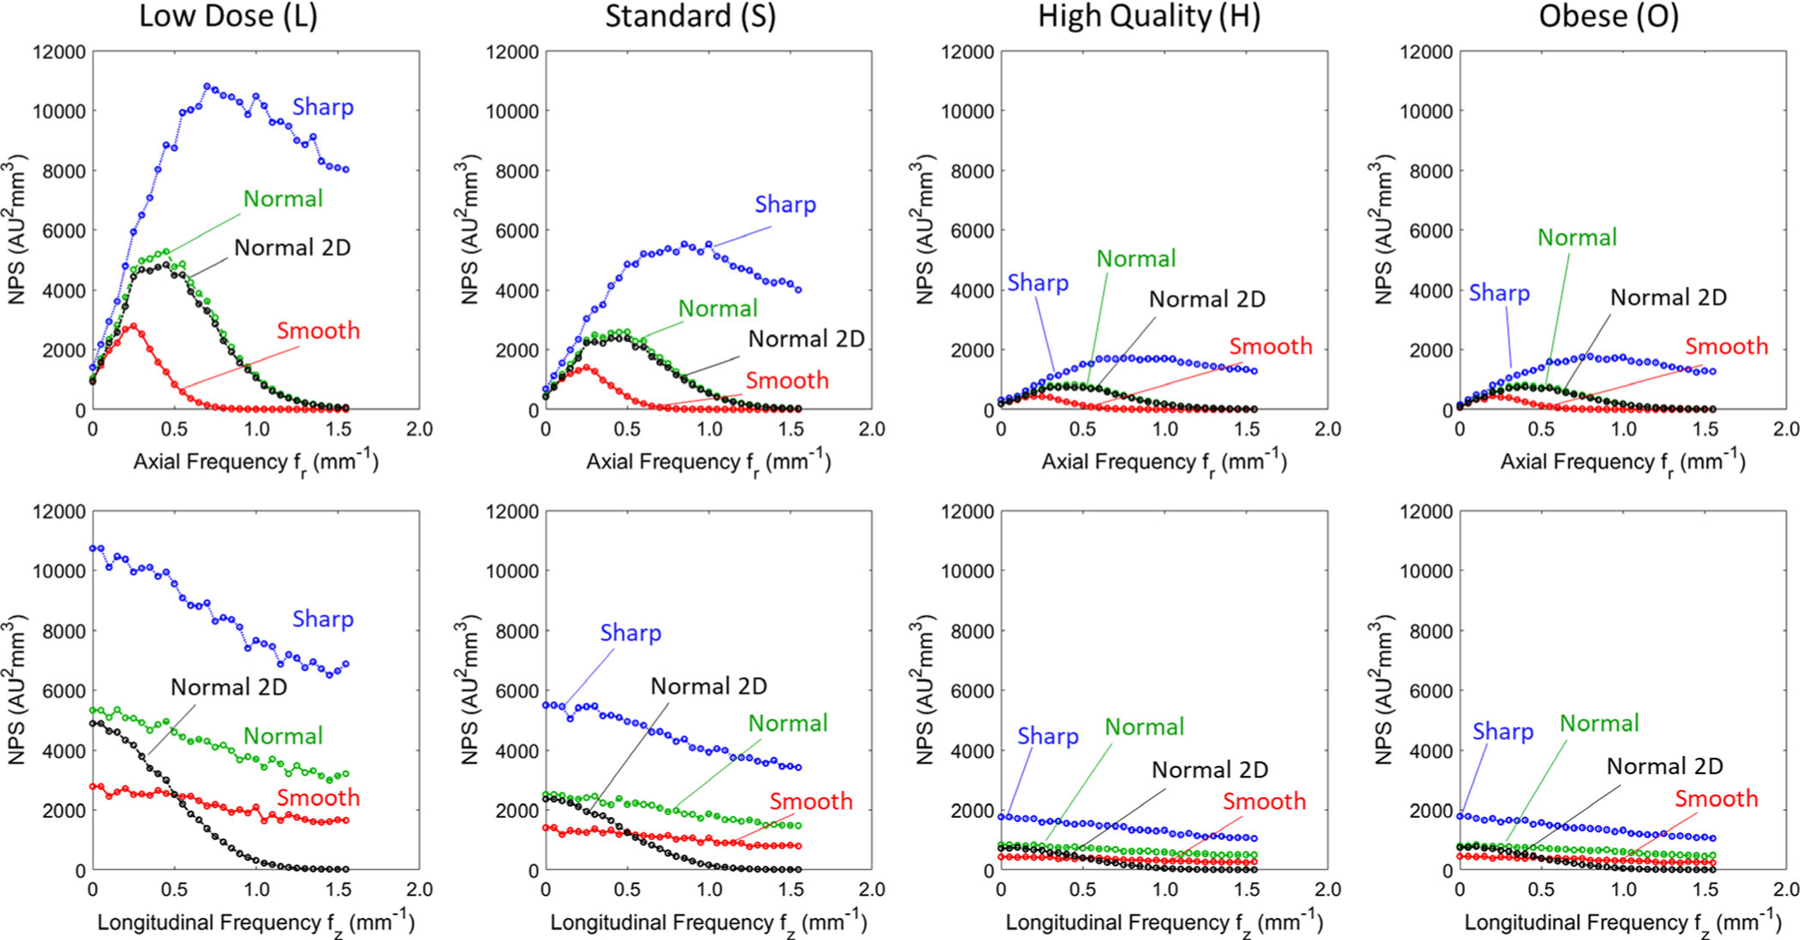
Fig. 6.

Noise-power spectrum (NPS). (Top) Axial and (Bottom) longitudinal NPS for each clinical protocol and reconstruction filter for FBP1. The NPS for FBP2 (Normal filter) is shown in black, denoted “Normal 2D.” The NPS is shown for frequencies up to the Nyquist (1.6 mm−1).
