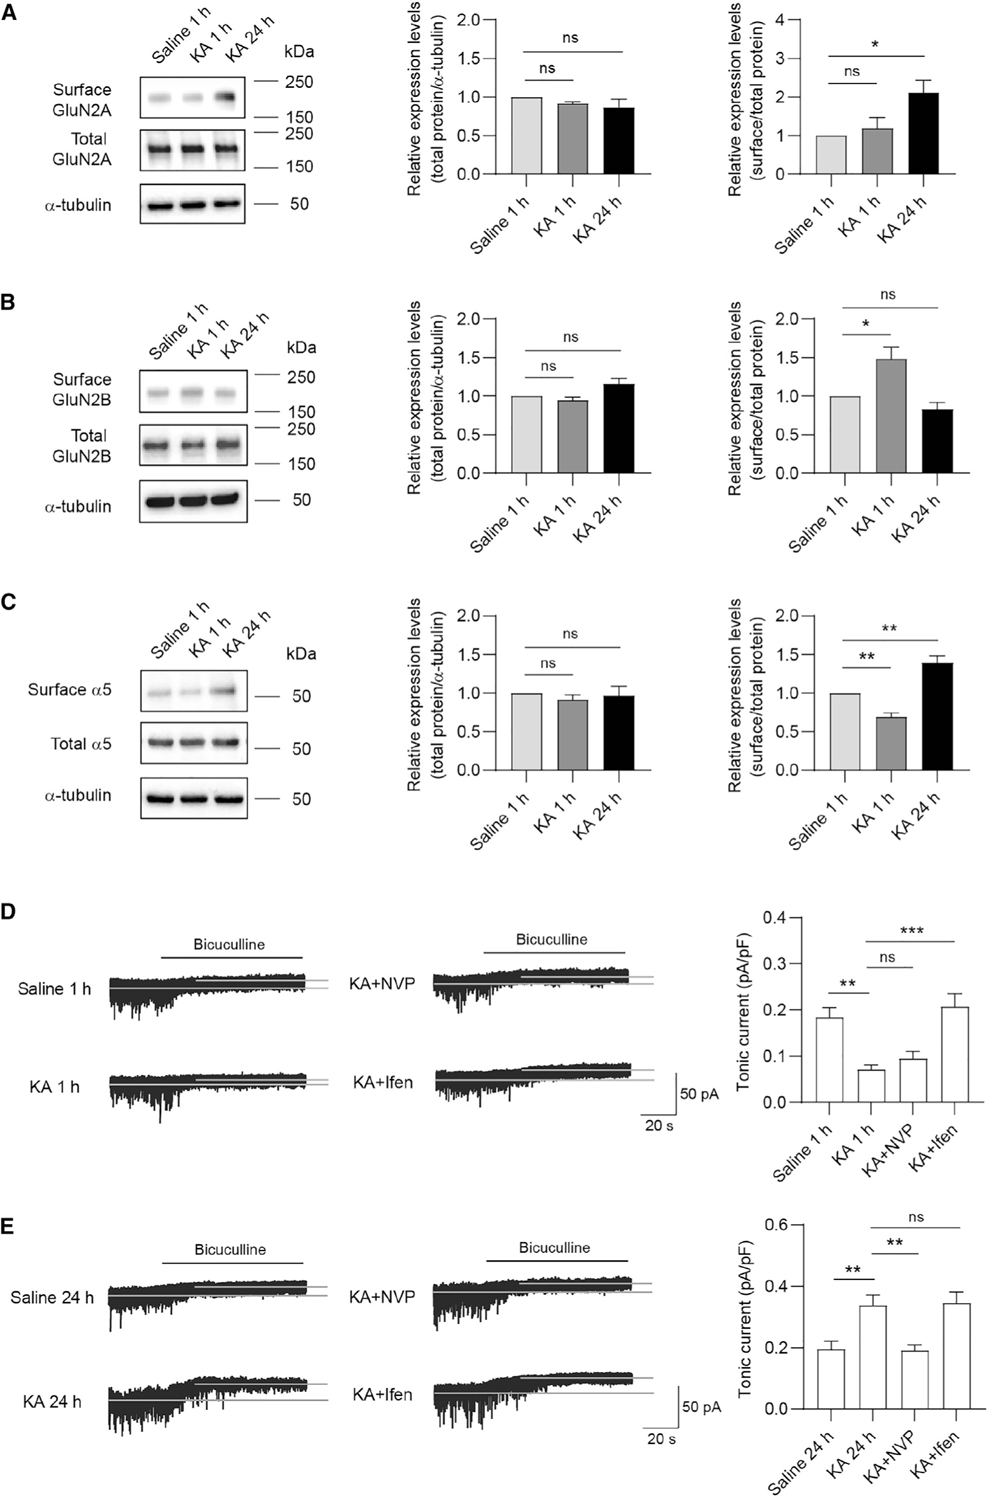
Figure 4. Pharmacological suppression of GluN2A- and GluN2B-NMDARs regulates tonic inhibition in the KA-induced seizure model.

(A–C) Representative western blots and summary graphs from cell-surface biotinylation assays showing that surface and total GluN2A (A, n = 3 independent experiments, one-way ANOVA test, F(2,6) = 5.928, p = 0.0379 with Dunnett’s multiple comparisons test, p = 0.0321), GluN2B (B, n = 3 independent experiments, one-way ANOVA test, F(2,6) = 10.80, p = 0.0103 with Dunnett’s multiple comparisons test, p = 0.0283), and α5-GABAAR (C, n = 4 independent experiments, one-way ANOVA test, F(2,9) = 34.75, p < 0.0001 with Dunnett’s multiple comparisons test, saline 1 h versus KA 1 h: p = 0.0098; saline 1 h versus KA 24 h: p = 0.0022) expression in the KA-induced seizure model.
(D and E) Tonic currents in hippocampal CA3 neurons were decreased 1 h after KA injection, whereas increased 24 h after KA injection. Ifen or NVP treatment 1 h prior to KA injection, respectively, restored the decreased or increased tonic currents at corresponding time point after KA injection. (D) n = 10 for each group, one-way ANOVA test, F(3,36) = 11.42, p < 0.0001 with Dunnett’s multiple comparisons test, saline 1 h versus KA 1 h: p = 0.0014; KA 1 h versus KA + Ifen: p = 0.0001. (E) n = 10 for each group, one-way ANOVA test, F(3,36) = 8.925, p = 0.0001 with Dunnett’s multiple comparisons test, saline 24 h versus KA 24 h: p = 0.0065; KA 24 h versus KA+NVP: p = 0.0047.
*p < 0.05, **p < 0.01, and ***p < 0.001. All data are presented as mean ± SEM.
See also Figure S4.
