FIGURE 4.
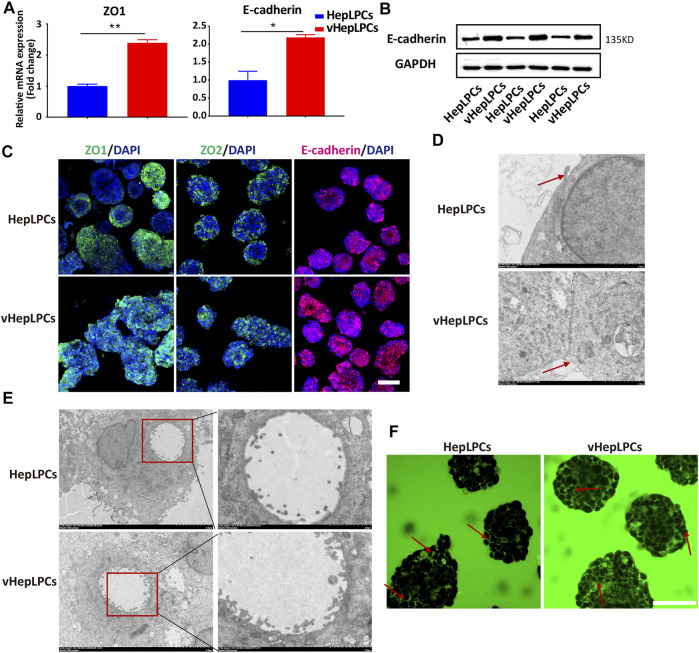
Co-culture of HepLPCs and HUVECs enhanced cell-cell tight junctions. (A)Gene expression was analyzed by qRT-PCR. Tight adhesion markers (ZO1, E-cadherin) were assessed. Data are normalized to HepLPCs. (B) Western blot analysis of the expression of E-cadherin in two groups (n = 3). (C) Immunofluorescent staining analyses of the expression of the tight junction markers, ZO1, ZO2, and E-cadherin, in HepLPCs and vHepLPCs. Nuclei were counterstained with DAPI. (D) Transmission electron microscopy results showed tight junctions between cells. vHepLPCs exhibited more complete tight junctions between cells, as indicated by the red arrow. (E) Representative TEM images. Electron microscopic analysis showed that the abundance and height of microvilli in vHepLPCs were significantly higher than in HepLPCs, suggesting that these structures are morphologically equivalent to villi that form in the bile canaliculi. (F) Live-imaging of CDF flow pathway from HepLPCs and vHepLPC spheroids. Red arrow pointed that the bile canaliculi network was formed by continuous tight junctions between polarized hepatocytes in vHepLPCs in magnificated pictures. Data are presented as means ± SEM. *p < 0.05, **p < 0.01. Scale bars, 100 µm.

