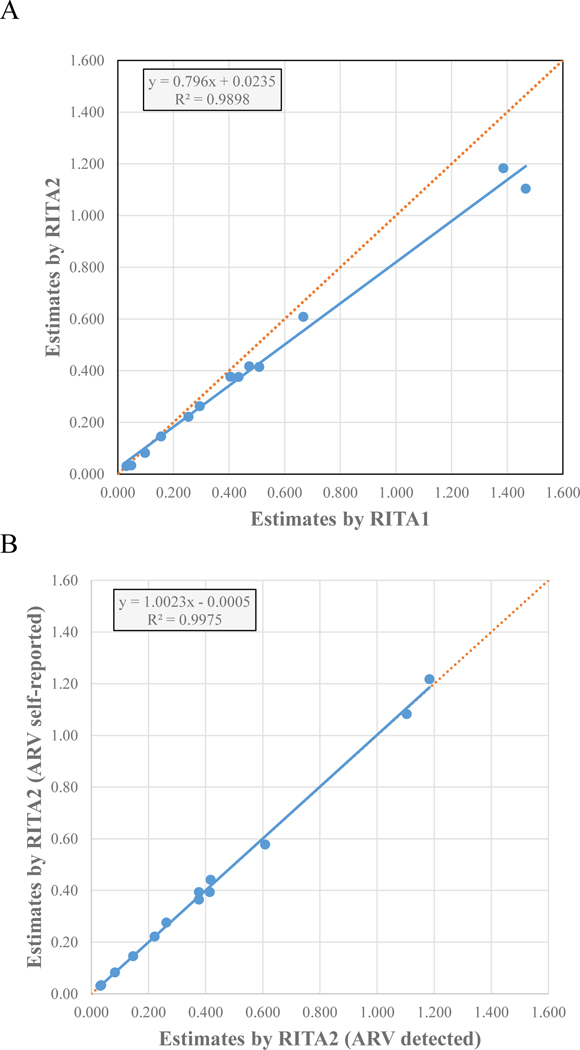
Figure 2.
Correlation of HIV-1 incidence estimates by RITA adjusting for exposure to ARV. A) Comparison of incidence estimates by RITA1 (LAg ODn ≤1.5 + VL ≥1000 RNA copies/mL) and RITA2 (LAg ODn ≤1.5 + VL ≥1000 RNA copies/mL + no ARV detected) B) Comparison of incidence estimates by RITA2 using ARV detection and RITA2 using self-reported ARV. Solid lines represent linear correlation trendlines with equation parameters and R2 shown for both plots. Dotted lines represent ideal fit with R2=1.0 and slope of 1.0 for comparison purposes.
Abbreviations: LAg, HIV-1 Limiting Antigen Avidity test; VL, HIV viral load test; RITA, recent infection testing algorithm; proportion false recent, PFR; normalized optical density values, ODn; ribonucleic acid, RNA; ARV, antiretroviral medication

