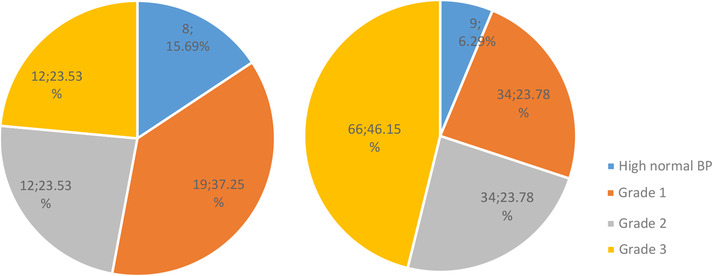
FIGURE 1.

Left pie diagram represented a scale model of lobar HICH and the right represented non‐lobar HICH. Both high normal and grade 1 hypertension showed an increase percentage in lobar areas than non‐lobar (52.9% vs. 30.1%). And the non‐lobar HICH showed an increase with the blood pressure level increasing
