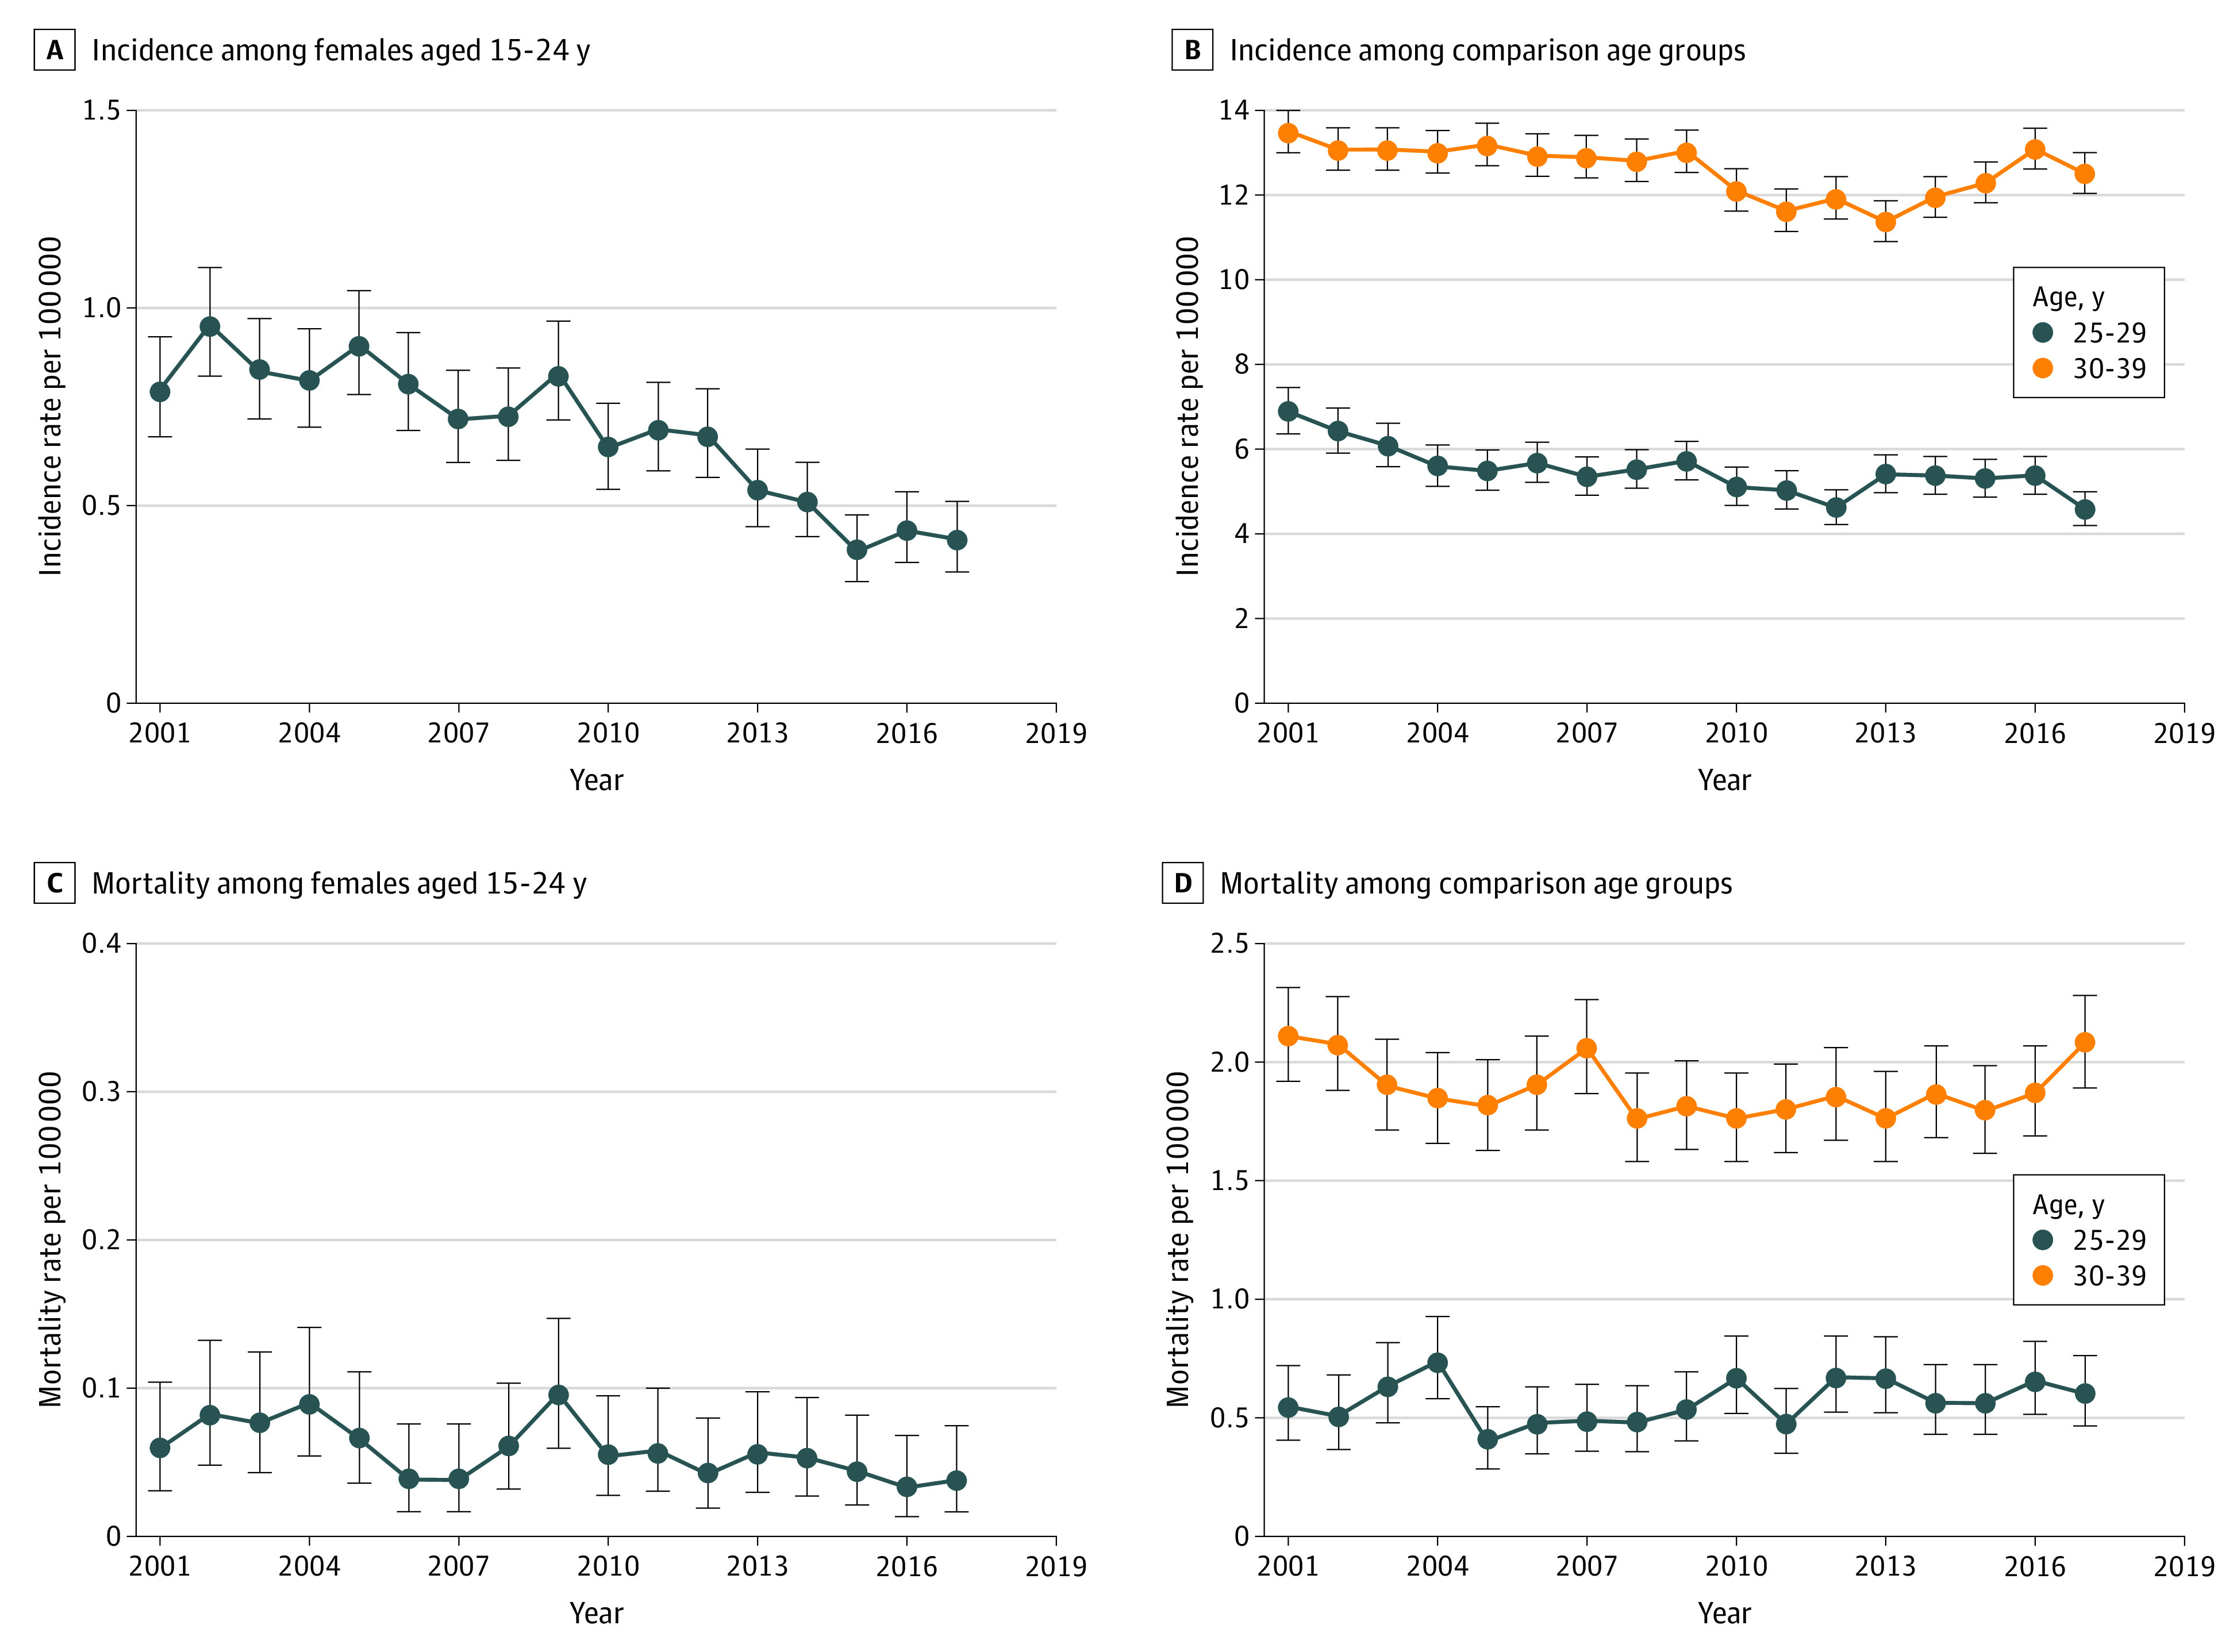
Figure. Temporal Patterns in Cervical Cancer Incidence and Mortality.

Cervical cancer incidence and mortality rates from 2001 through 2017 among girls and women aged 15 to 39 years are shown, separated by age subgroups. Data sources: Combined Surveillance, Epidemiology, and End Results and National Program of Cancer Registries databases (incidence) and National Center for Health Statistics (mortality).
