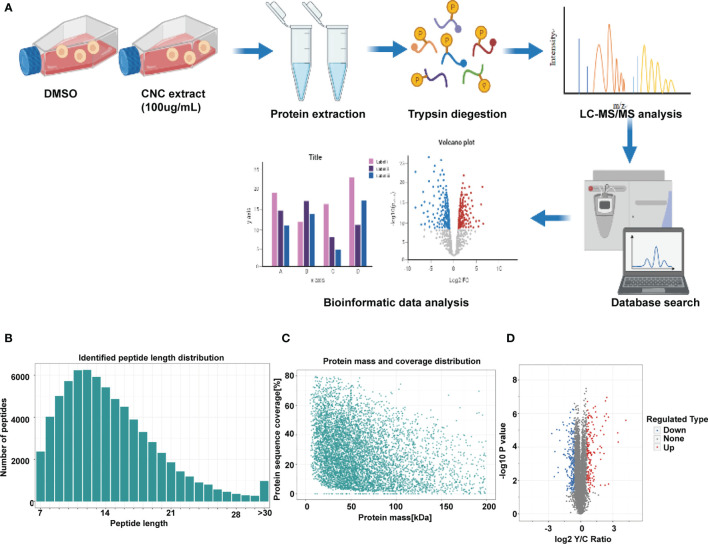
Figure 3.
Differentially expressed proteins were evaluated by proteomics. (A) Flow diagram of 4D Label-free proteomics. (B) Length distribution of the peptides identified by mass spectrometry. (C) Relationship between protein molecular weight and coverage. (D) Volcano plot of differentially expressed proteins. The blue dots are down-regulated proteins. The red dots are up-regulated proteins. There were three duplicate samples in each experiment.

