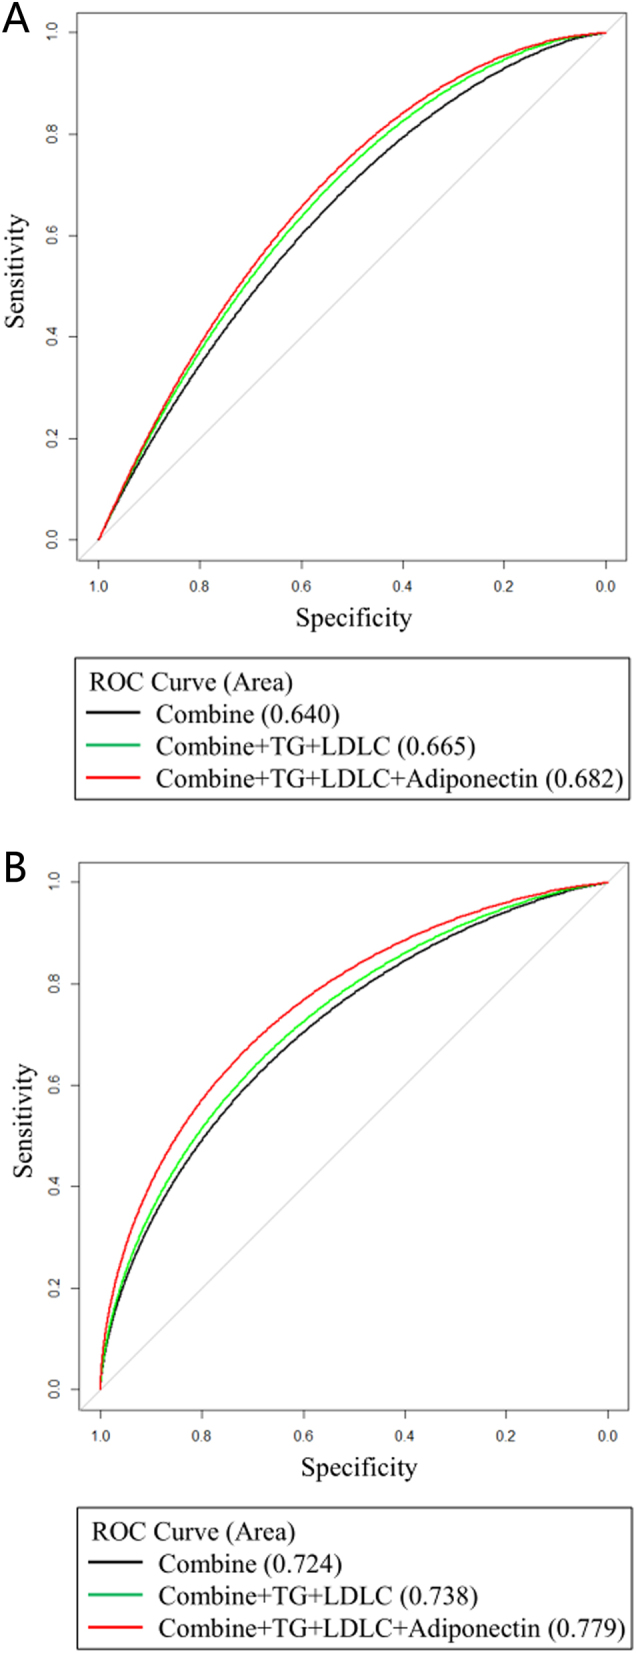
Figure 4.

ROC curve of the association of adiponectin with pre-diabetes in cluster 1 (A). Black curve, combined mode (represents the predictive ability of age, BMI, and SBP for pre-diabetes), the AUC is 0.640; green curve, combined mode added with TG and LDL-C, the AUC is 0.665; red curve, combined mode added with TG, LDL-C, and adiponectin, the AUC is 0.682. ROC curve of association of adiponectin with diabetes in cluster 4 (B). Black curve, combined mode (represents the predictive ability of age, BMI, and SBP for diabetes), the AUC is 0.724; green curve, combined mode added with TG and LDL-C, the AUC is 0.738; red curve, combined mode added with TG, LDL-C, and adiponectin, the AUC is 0.779.

 This work is licensed under a