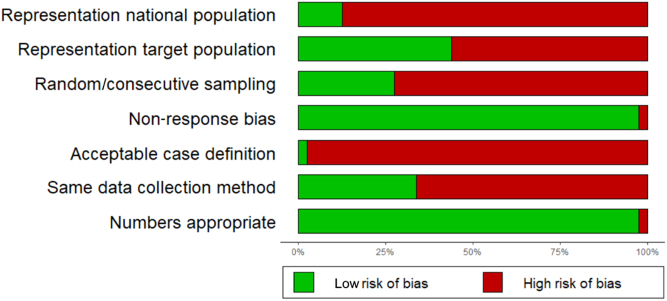
Figure 2.
Risk of bias graph depicting the assessment of the methodological quality of included primary studies. Risk of study bias items assessed: aStudy’s target population as a close representation of the vHL national population. bSampling frame as a true or close representation of the target population. cSample selection based on a random/consecutive process. dLikelihood of nonresponse bias. eAcceptable case definition used in the study. fSame mode of evaluation for all subjects. gNumerator and denominator appropriate.

 This work is licensed under a