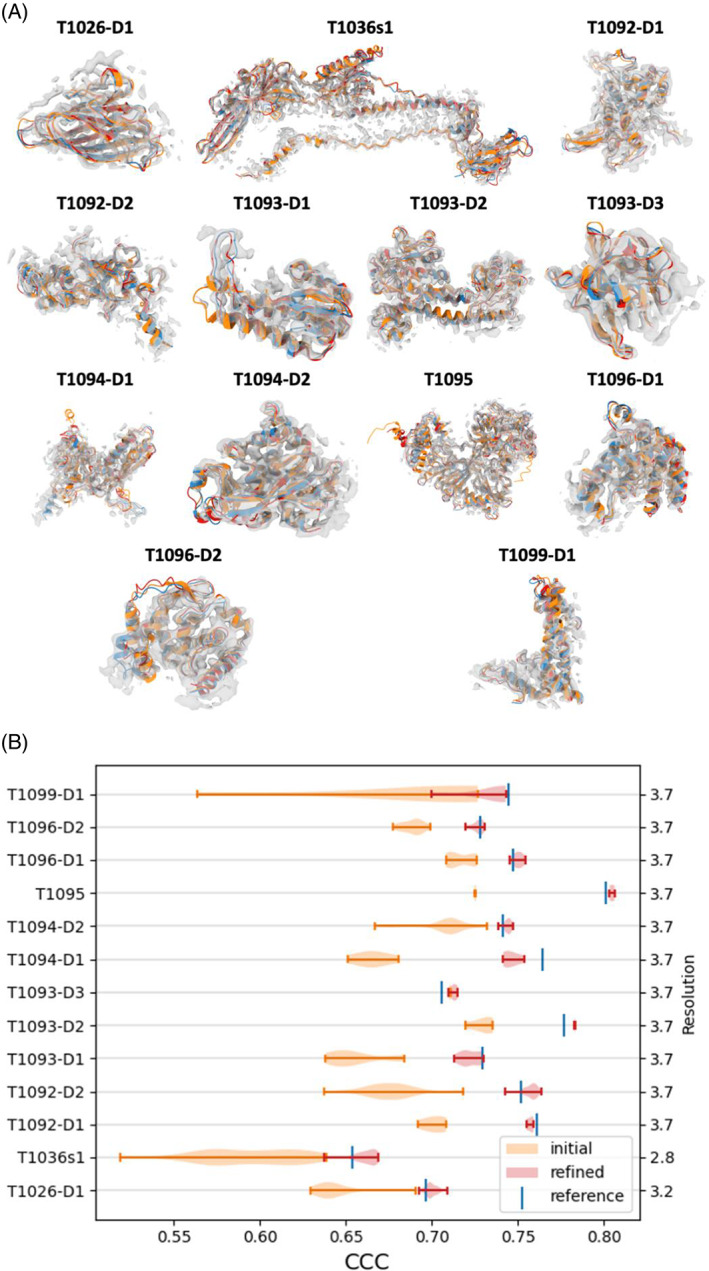
FIGURE 4.

(A) Single domain refinement: Reference structure (blue), best model (orange), best model after refinement (red), against the map, contoured to only show high‐intensity voxels (gray). Bright colors indicate that the structure is outside the density. (B) Average CCC (TEMPy) before and after refinements, across targets, compared to the reference structure. The refinements significantly improve the average CCC for all targets. Target name is on the left axis and resolution is on the right
