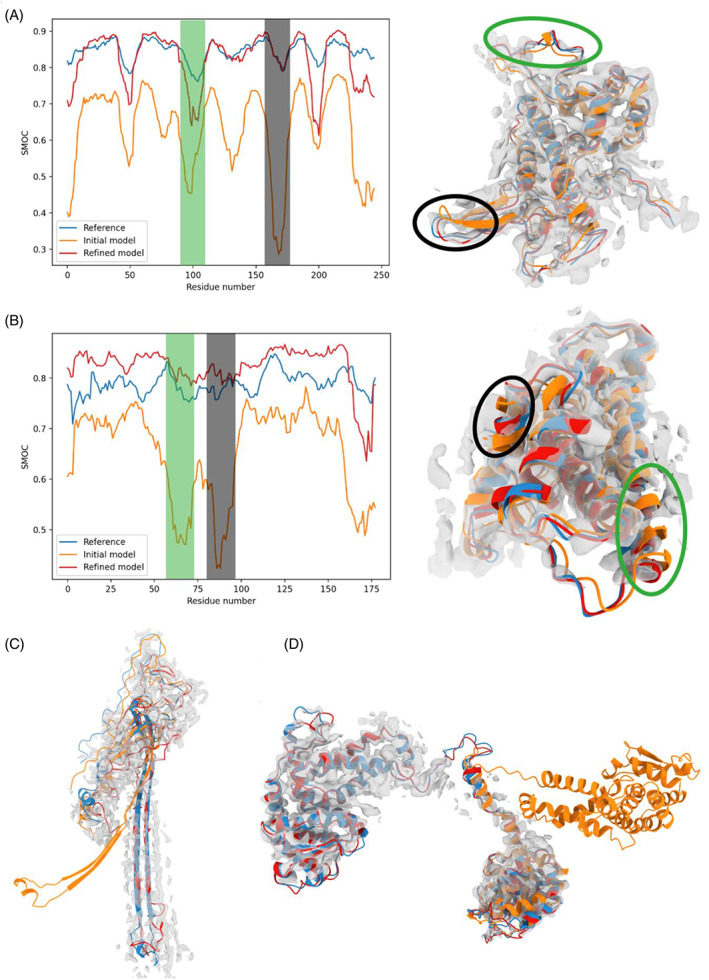
FIGURE 6.

Examples of improvement in structural elements in the refined CASP models: (A) (T1092‐D1) and (B) (T1099). Left: SMOC scores for the reference structure (blue), best predicted structure before refinement (orange) and after (red). The gray and green shaded areas indicate regions of lower score in the predicted structure, highlighting a locally worse fit. Right: Representation of the structures within the map. The regions surrounded by a blue and black oval correspond to the shaded areas in the left diagram. (C) Structure of the reference L/P flagellar ring structure subunit T1047 (blue), best predicted model (orange) and after refinement (red). (D) Structures of the reference structure T1096 (blue), and best predicted model before refinement (orange) in the map
