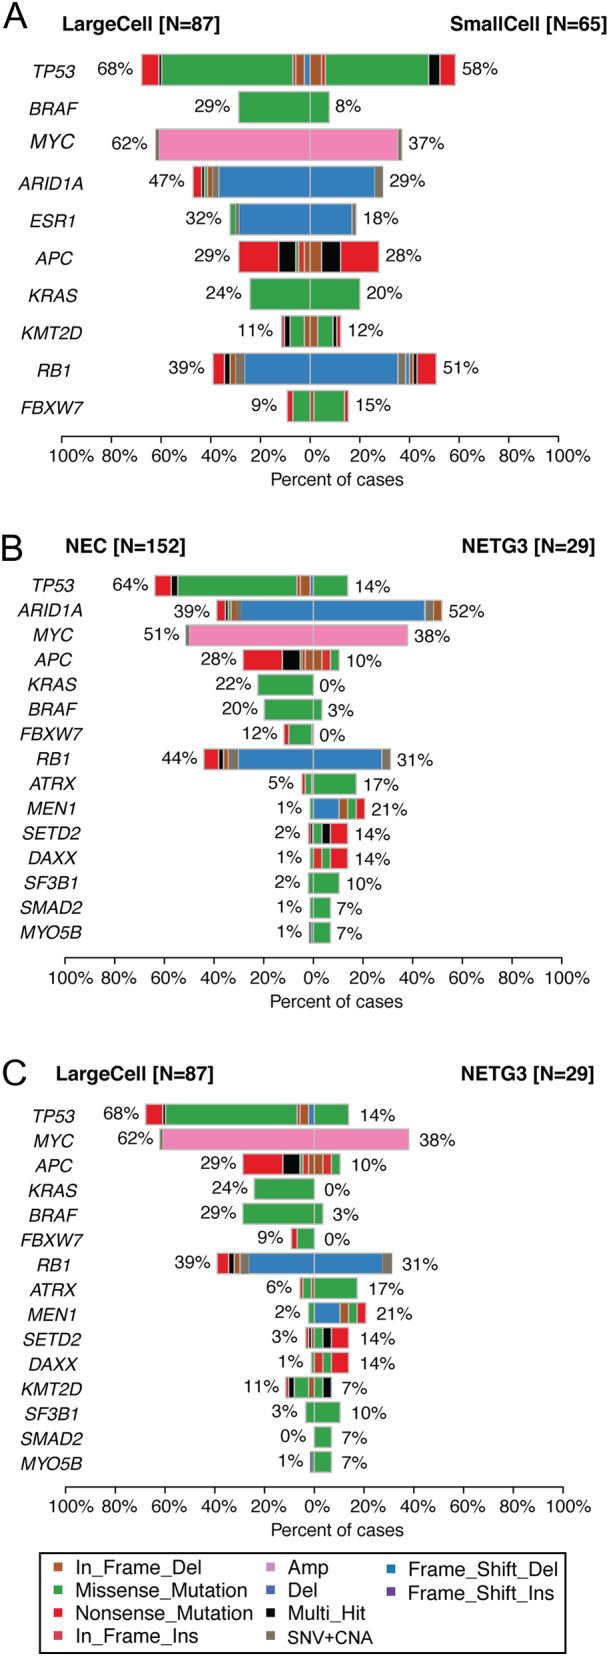
Figure 4.

Co-bar plots illustrating the differences in mutation frequencies for the most frequently mutated genes, between (A) large cell NEC (n = 87) vs small cell NEC (n = 65), (B) NEC (n = 152) vs NET G3 (n = 29) and (C) large cell NEC (n = 87) vs NET G3 (n = 29).

 This work is licensed under a