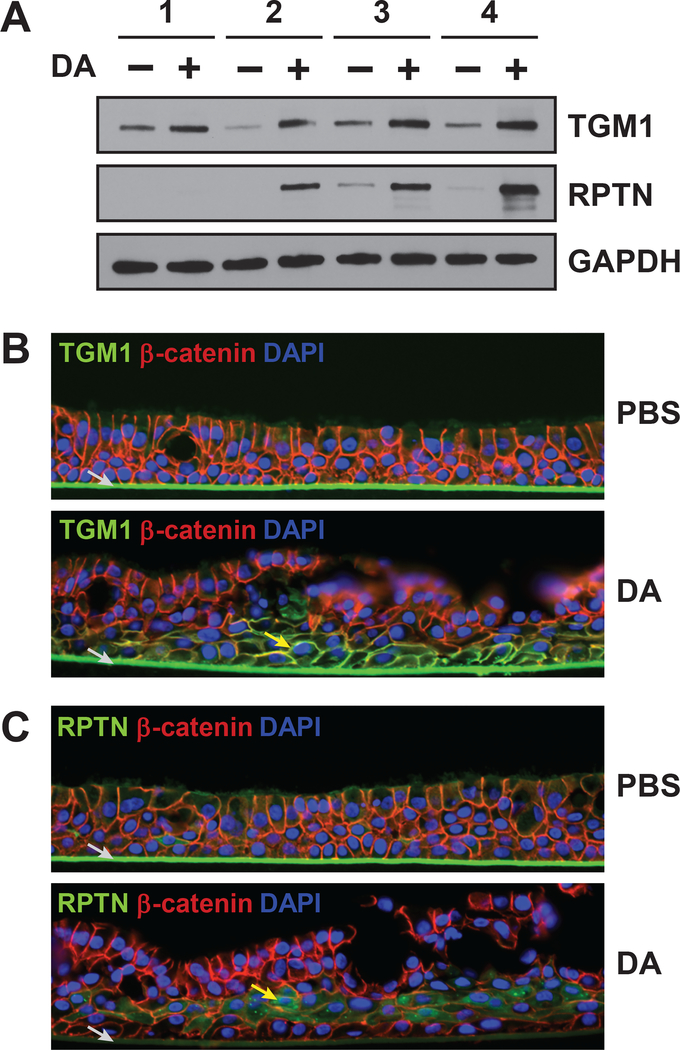
Figure 4. Markers of squamous differentiation are increased in DA-exposed cells.
A) The levels of TGM1, repetin and GAPDH in cell lysates were visualized by western blotting. B-C) Immunofluorescence was performed on cross sections of formalin-fixed and paraffin-imbedded TBECs to visualize (B) repetin (green, Alexa Fluor 488), β-catenin (red, Alexa Fluor 594) and nuclei (blue, DAPI) in donor 3, and (C) TGM1 (green, Alexa Fluor 488), β-catenin (red, Alexa Fluor 594) and nuclei (blue, DAPI) in donor 3. Localization of repetin and TGM1 immunostaining is indicated by yellow arrows in (B) and (C), respectively. Non-specific staining of transwell membrane by secondary antibody is indicated by grey arrow. Images in (B) are representative of three different sections per condition (Fig. S4, A–B), and results were replicated in a single section from donor 2 (Fig. S4, C–D). Images in (C) are representative of three different sections per condition (Fig. S5, A–B), and results were replicated in single sections from donors 2 and 4 (Fig. S5, C–F).

