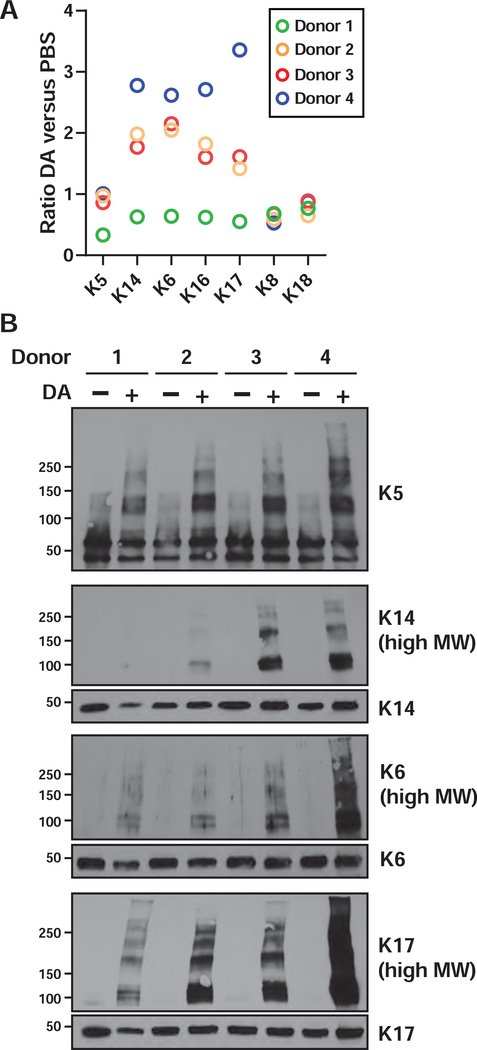
Figure 5. DA exposure induces crosslinking of basal cell cytokeratins.
A) Fold changes were plotted for the basal cell keratins, and clara cell marker CCSP, as determined by proteomic analysis. Note that keratin expression values were re-calculated from isoform-specific peptides (Tables S7–S8). B) The expression and “crosslinking” of cytokeratins was visualized by western blotting of whole cell lysates. For K14, K6 and K17, panels labeled as (high MW) are longer exposures of the identical membranes from which the ~50 kDa keratin monomers were visualized.

