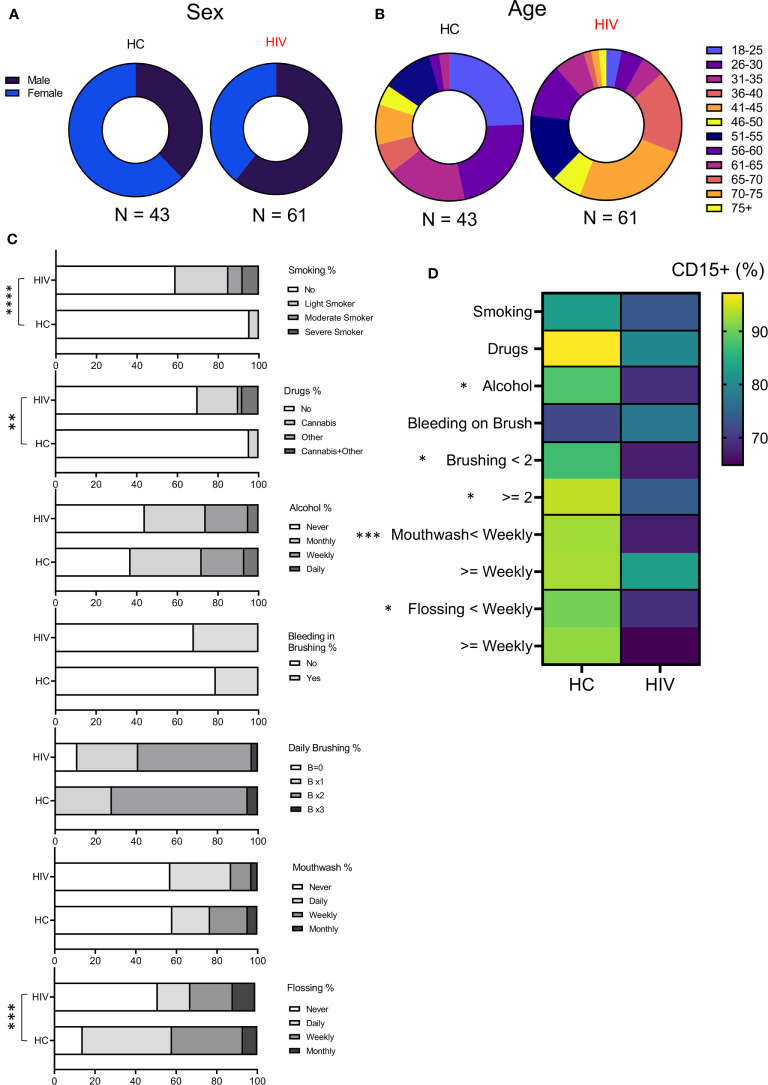
Figure 5.
Demographics and habits assessment of participants. (A) Showing the sex distribution with 37% and 63% females and males, respectively in HCs, 61% and 39% for males and females in HIV-infected group. (B) Showing the age distribution among participants. HC group was enriched with younger population according to Fischer’s exact test analysis (P = 0.02). (C) Cumulative data illustrating participant’s habits such as smoking, drug use, alcohol consumption, daily oral health. (D) Cumulative data showing the correlation of neutrophils’ percentages with study participants’ habits. (****P < 0.0001, ***P = 0.0001, **P < 0.001, *P < 0.05).

