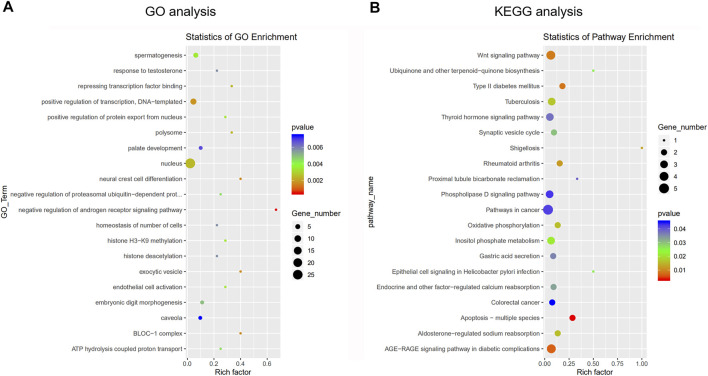
FIGURE 3.
Gene ontology (GO) analysis and Kyoto Encyclopedia of Genes and Genomes (KEGG) pathway annotation of differentially expressed circRNAs between young group and old group. (A) The bubble chart shows the top 20 most significantly enriched and meaningful GO terms related to the altered circRNAs ranged according to the predicted p-values. (B) The bubble chart shows the top 20 most significantly enriched pathways depending on age. The enrichment factor on the X-axis indicates the specificity of a pathway activating in old samples compared with young samples. The bubble size represents the number of circRNAs enriched in a GO terms or pathway. The red bubble indicates a more significant GO terms or pathway.

