FIGURE 5.
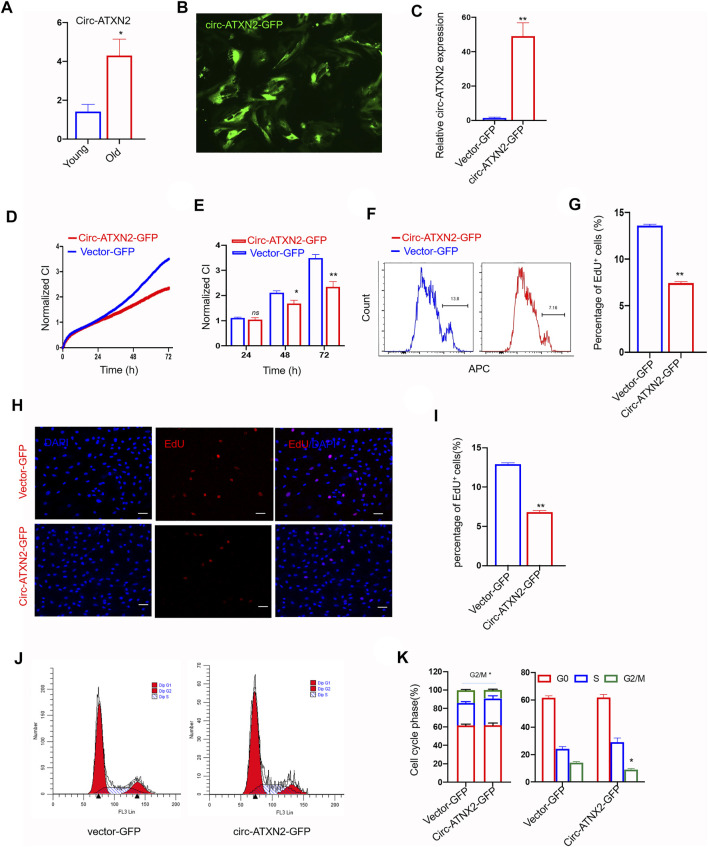
Circ-ATXN2 overexpression inhibited proliferation in rat adipose-derived stromal cells (ASCs). (A) The relative gene expression of circ-ATXN2 after RNase R treatment (n = 4, *p < 0.05 versus young group, statistical analysis was performed by Student’s t test). (B) Transfection efficiency of circ-ATNX2 based on the expression of GFP in rat ASCs observed by fluorescence microscope. (C) Validation of circ-ATNX2 over-expression-vector in rat ASCs by qPCR. Results were presented as mean ± SEM, by Student t test, n = 6; **p < 0.01. Cell proliferation was accessed by xCELLigence real-time cell analysis (RTCA) system assay (D–E) and EdU incorporation assay (F–I). D. Cell proliferation was assessed using RTCA for 72 h. Statistics at 24, 48 and 72 h(E). Cell Index (CI) is an arbitrary unit reflecting the electronic cell-sensor impedance. Results were presented as mean ± SEM, by two-way ANOVA, n = 3; *p < 0.05, **p < 0.01. F. Representative images of cell proliferation were assayed using EdU incorporation by flow cytometry. (G) Statistics results were presented as mean ± SEM, by Student t test, n = 3; **p < 0.01. (H) Representative fluorescence microscope images of cell proliferation was assayed using EdU incorporation. EdU positive cell was red. DAPI was blue. Scale bars: 20 µm. (I) Statistics data of EdU assay were presented as mean ± SEM, by Student t test, n = 3; **p < 0.01. Cell phases of the circ-ATXN2 overexpression cells were analyzed by flow cytometry (J) and statistics (K). Results were presented as mean ± SEM, by Student’s t test, n = 3; *p < 0.05. ns: not significant.

