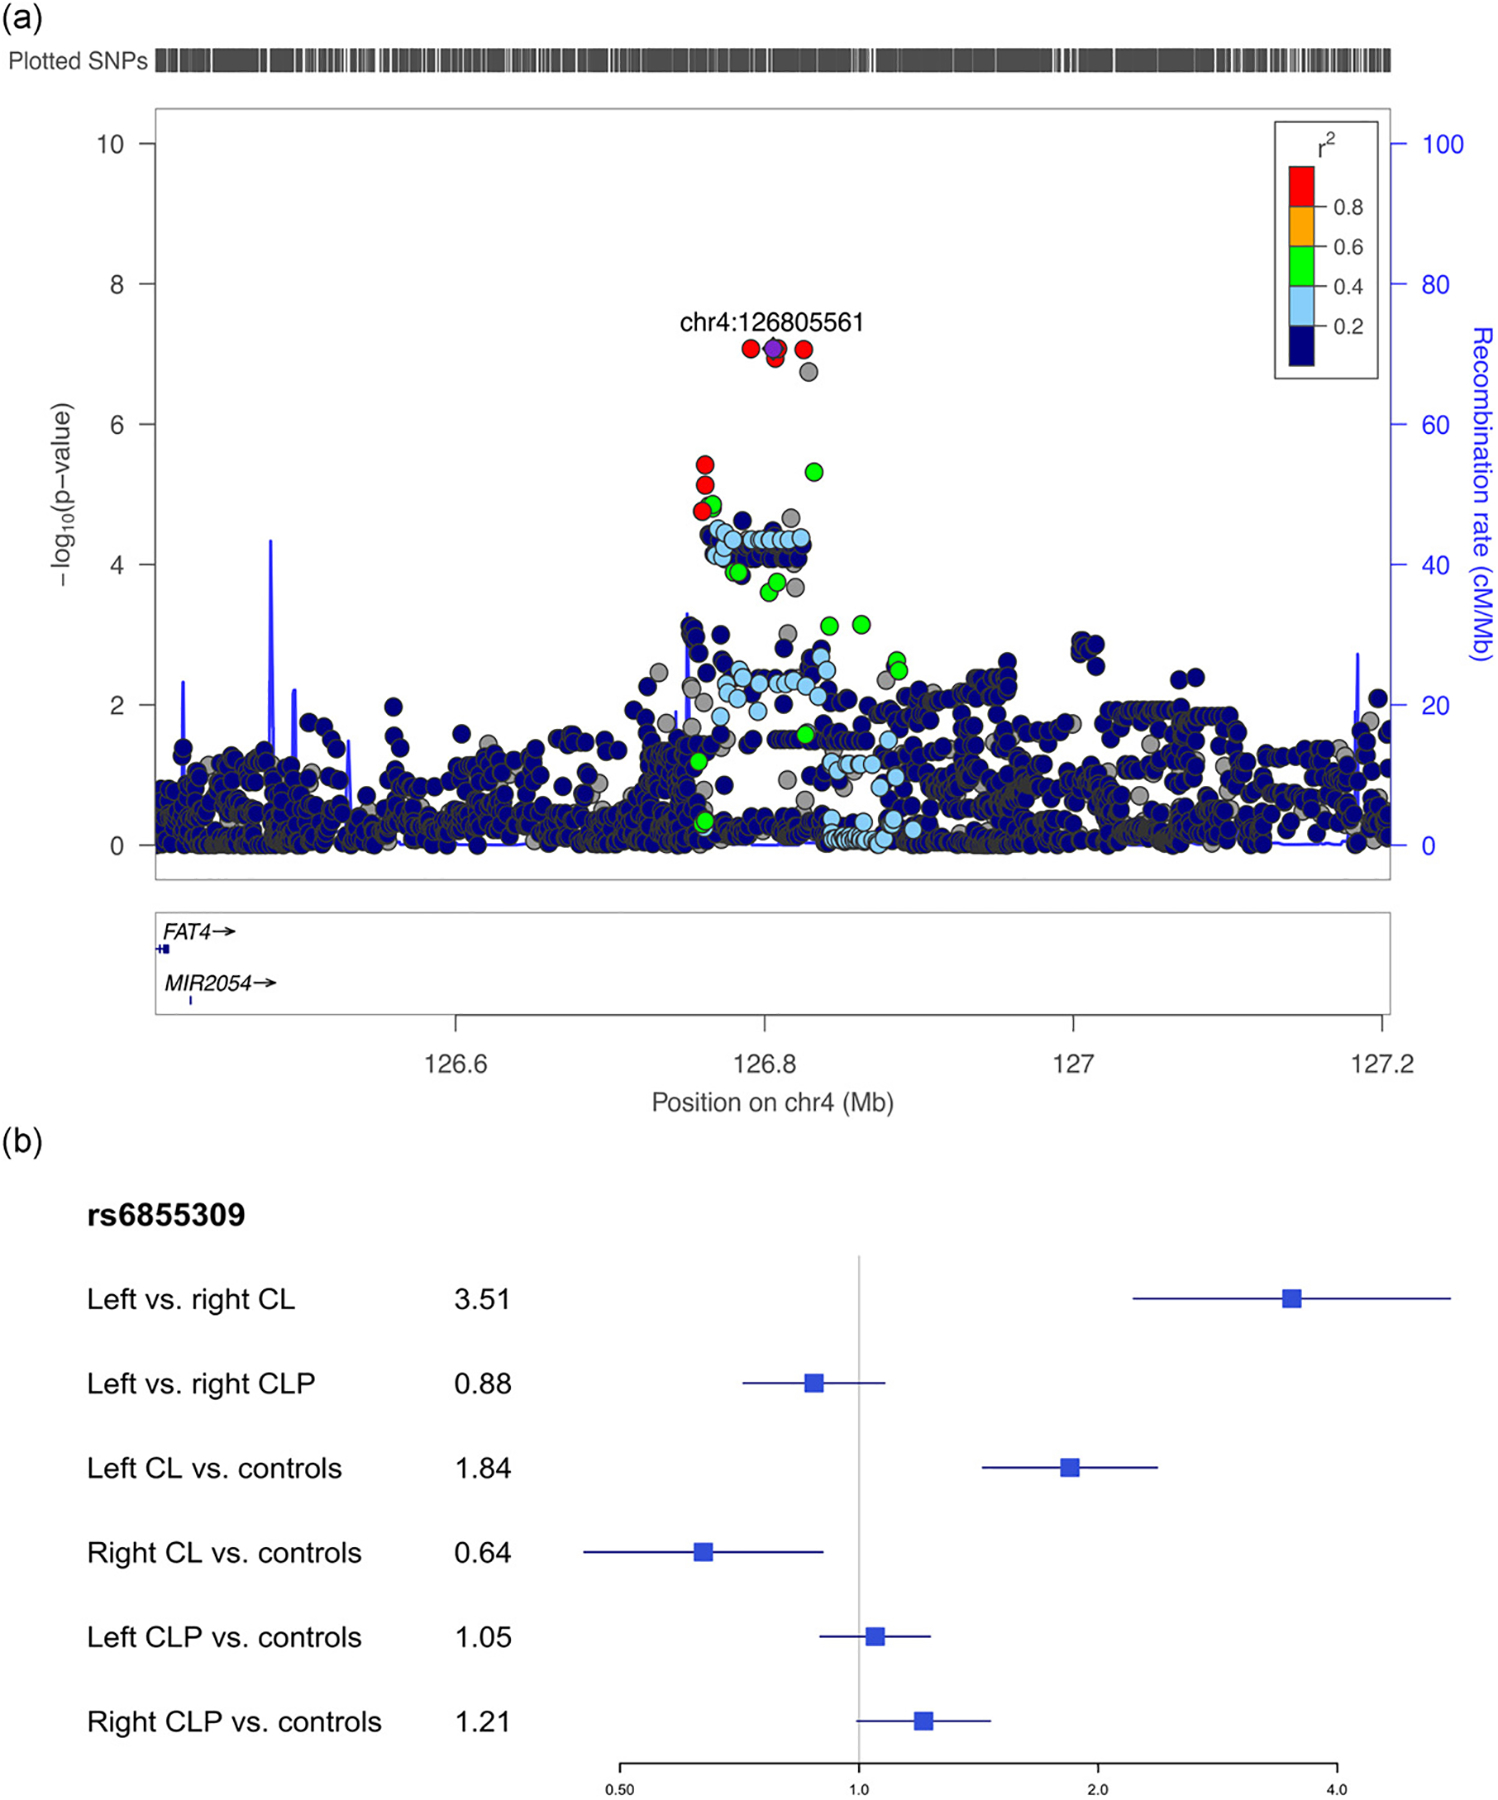
Figure 4:

Regional association plots showing −log10(p-values) for the suggestive peak at 4q28 in the modifier analysis in cleft lip (A). Plots were generated using LocusZoom (R. J. Pruim et al., 2010).The recombination overlay (blue line, right y-axis) indicates the boundaries of the LD block. Points are color coded according to pairwise LD (r2) with the index SNP. The odds ratio for this locus in each of the modifier and subtype specific loci were also compared (B).
