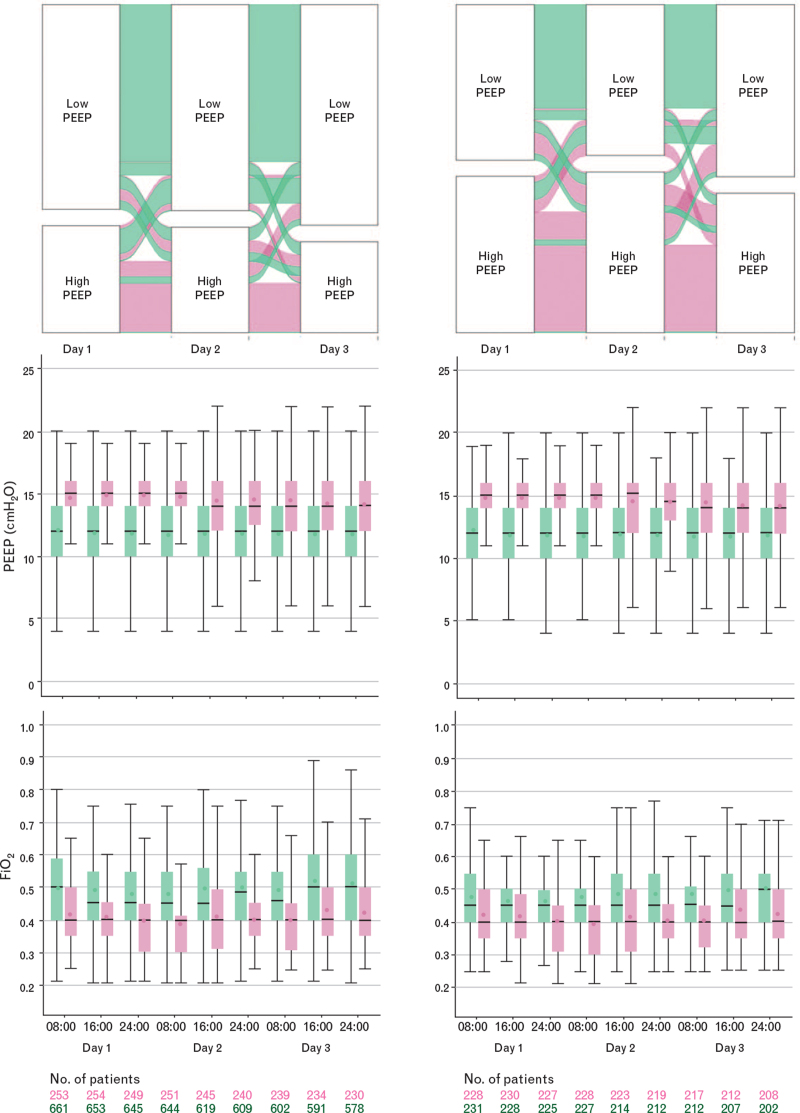
Fig. 1.
Group assignment, positive end-expiratory pressure and FiO2 in the higher (pink) and lower (green) positive end-expiratory pressure groups, before (left panels) and after (right panels) matching. The figure shows the median, lowest and highest positive end-expiratory pressure and FiO2 values. Horizontal bars inside boxes represent medians; box tops and bottoms, interquartile ranges. Whiskers extend to 1.5 times the interquartile range beyond the first and third quartiles per the conventional Tukey method. Circles represent means.

