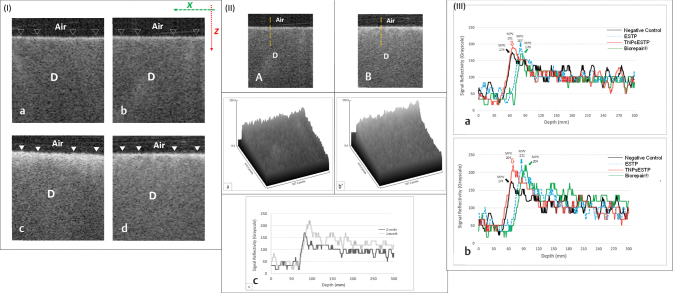
Fig. 4.
Biorepair (positive control) group: (I) Representative B-scans for 2 weeks (a, b) and 1 month (c, d). A marked increase in surface reflectivity of dentin (solid white triangles) along Z -axis was observed in comparison to the same area indicated by hollow triangles. (II) Representative OCT scans and their signals analyses after 2 weeks (a, ậ) and 1 month (b, ḇ’); the vertical broken lines represent A-scan. After 2 weeks, a light bright band of pixels was seen along the surface in comparison to the intense backscattered reflection after 1 month. The presented surface plots (ậ, ḇ’), corresponding to the OCT scans in (a) and (b), respectively, showed an increase in surface density as indicated by the difference in grayscale peaks. The signal reflectivity at the outer dentin surface after 1 month was greater than 2 weeks (c). (III) Representative plot of signals for different groups after 2 weeks (a) and 1 month (b) acquired by A-scan measurement of MPV. D, dentin; MPV, maximum pixel value; OCT, optical coherence tomography.

