Fig. 1.

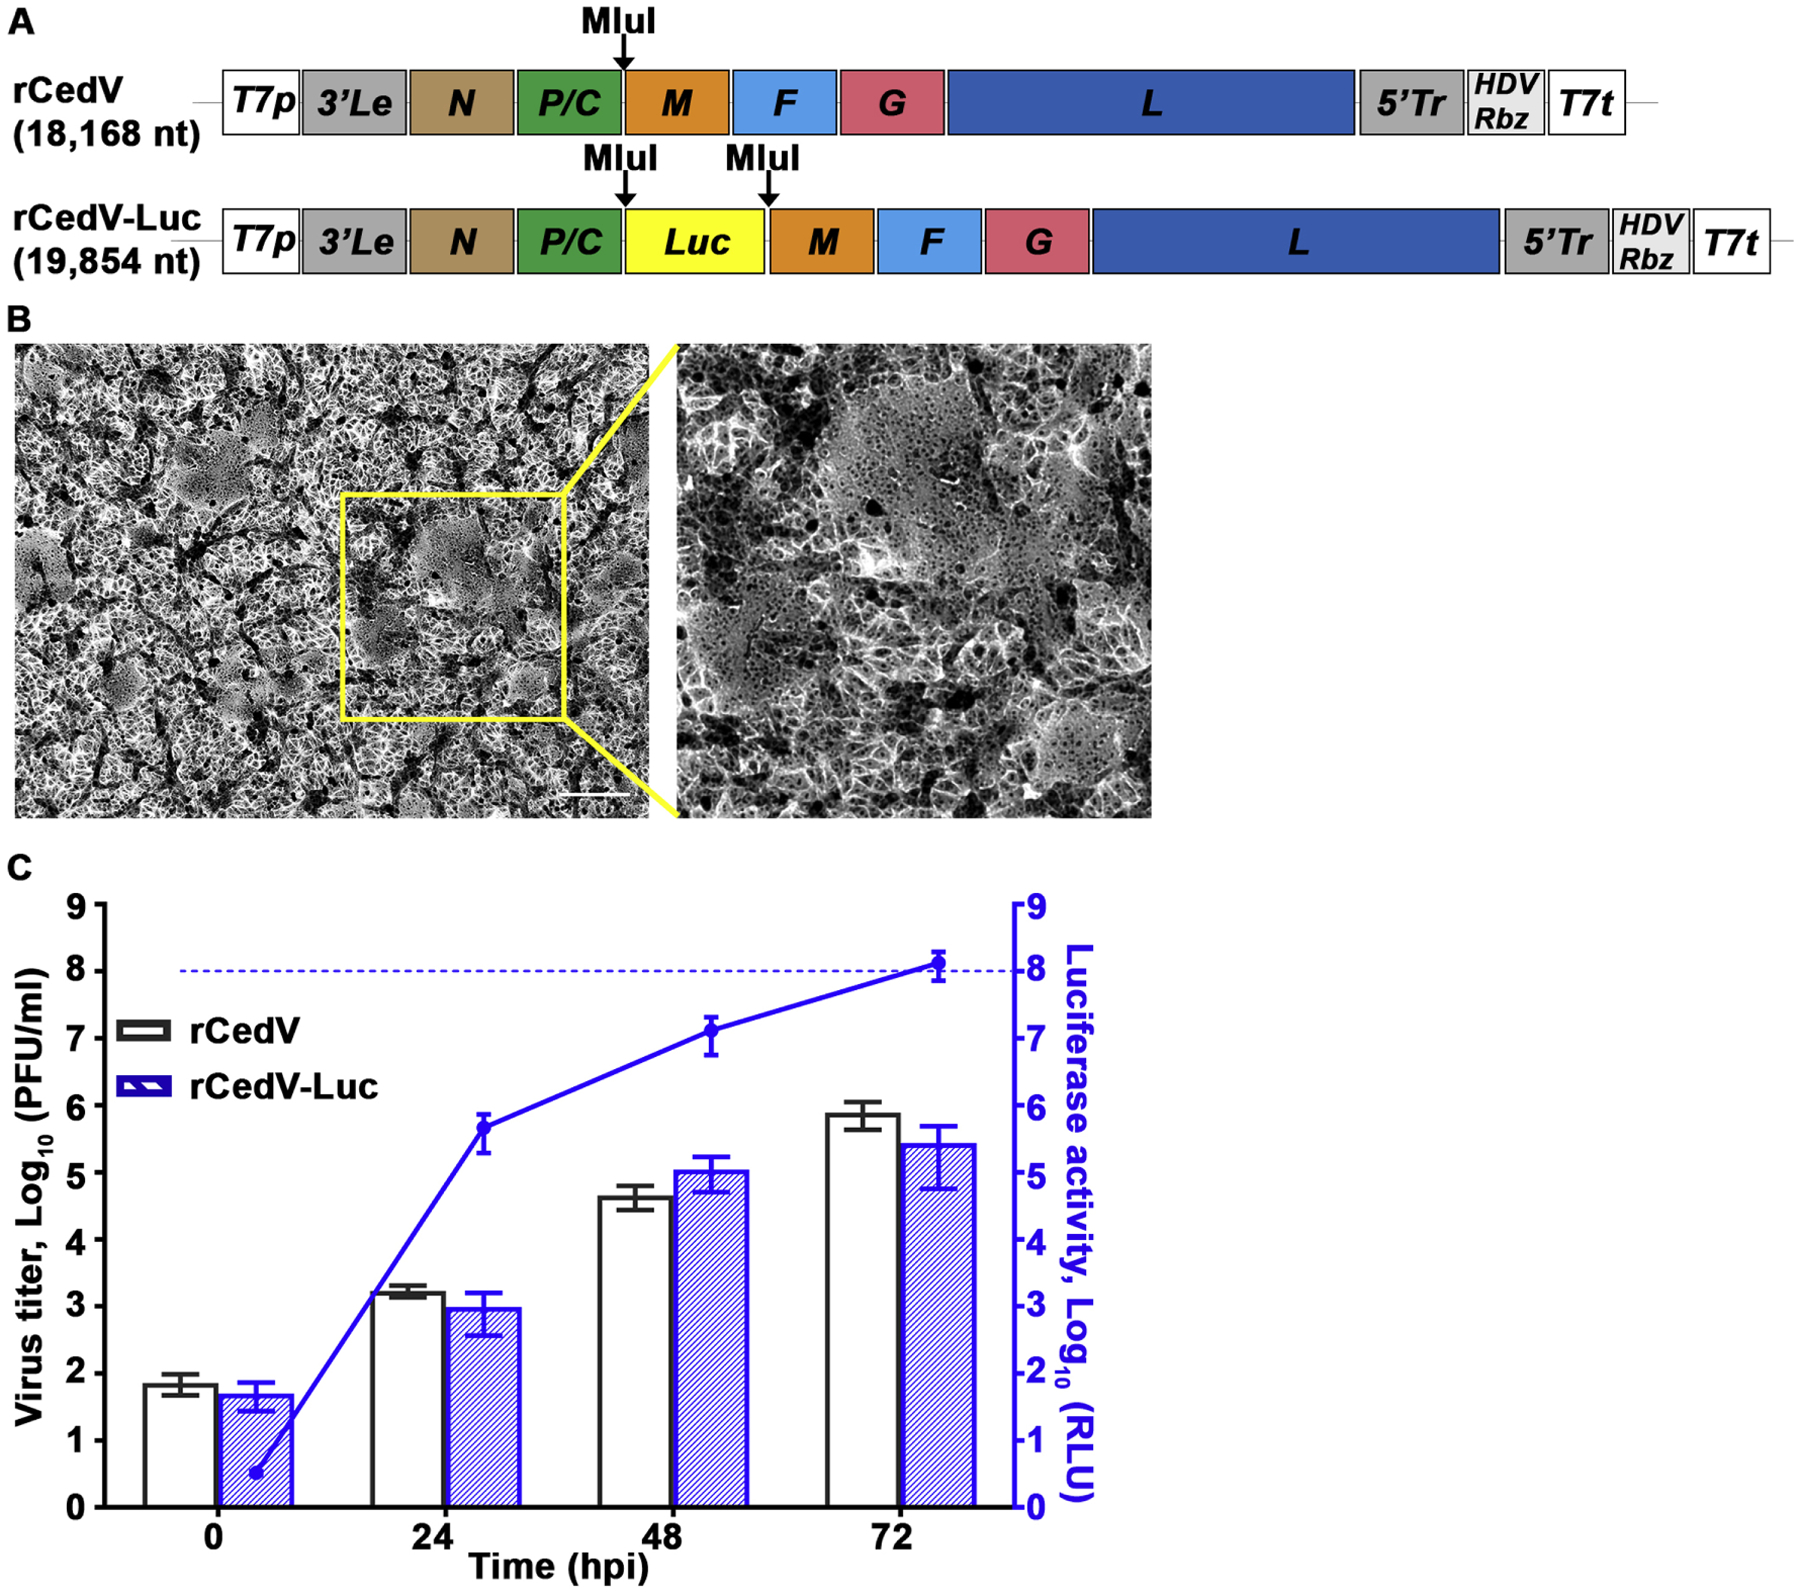
Characterization of recombinant CedV expressing luciferase. A) Schematic representation of rCedV antigenome in the pOLTV5 vector. The firefly luciferase (Luc) gene was inserted at the unique MluI restriction site between the P and M genes to produce rCedV-Luc. To preserve the “rule of six”, an additional start codon was added to the 5’ terminus of the Luc gene. B) At 48 hpi Vero E6 cells infected with rCedV-Luc were fixed with methanol and stained with 0.5% crystal violet solution (80% methanol). Images were captured with a Zeiss Axio Observer A1 inverted microscope using a 5X objective. Yellow box indicates giant cells, and scale bar represents 50 μm. Inset indicates zoomed-in region within the yellow box. C) Vero E6 cells in a 96-well plate were infected with either rCedV or rCedV-Luc at an MOI of 0.01. At 0, 24, 48 and 72 hpi supernatants were collected and viral titers determined by plaque assay and calculated as PFU/ml. Concurrently all infected cells were lysed and relative light units (RLU) were measured and calculated by subtracting the signal of rCedV infected cells from the signal of the rCedV-Luc infected cells and are represented on the right Y-axis in blue. The data represent mean ± standard error from two independent experiments. The blue dashed line represents the upper limit of detection of the luminometer. Viral titers and luciferase activity levels at 0 hpi indicate the lower limit of detection for the plaque assay and the luminometer, respectively.
