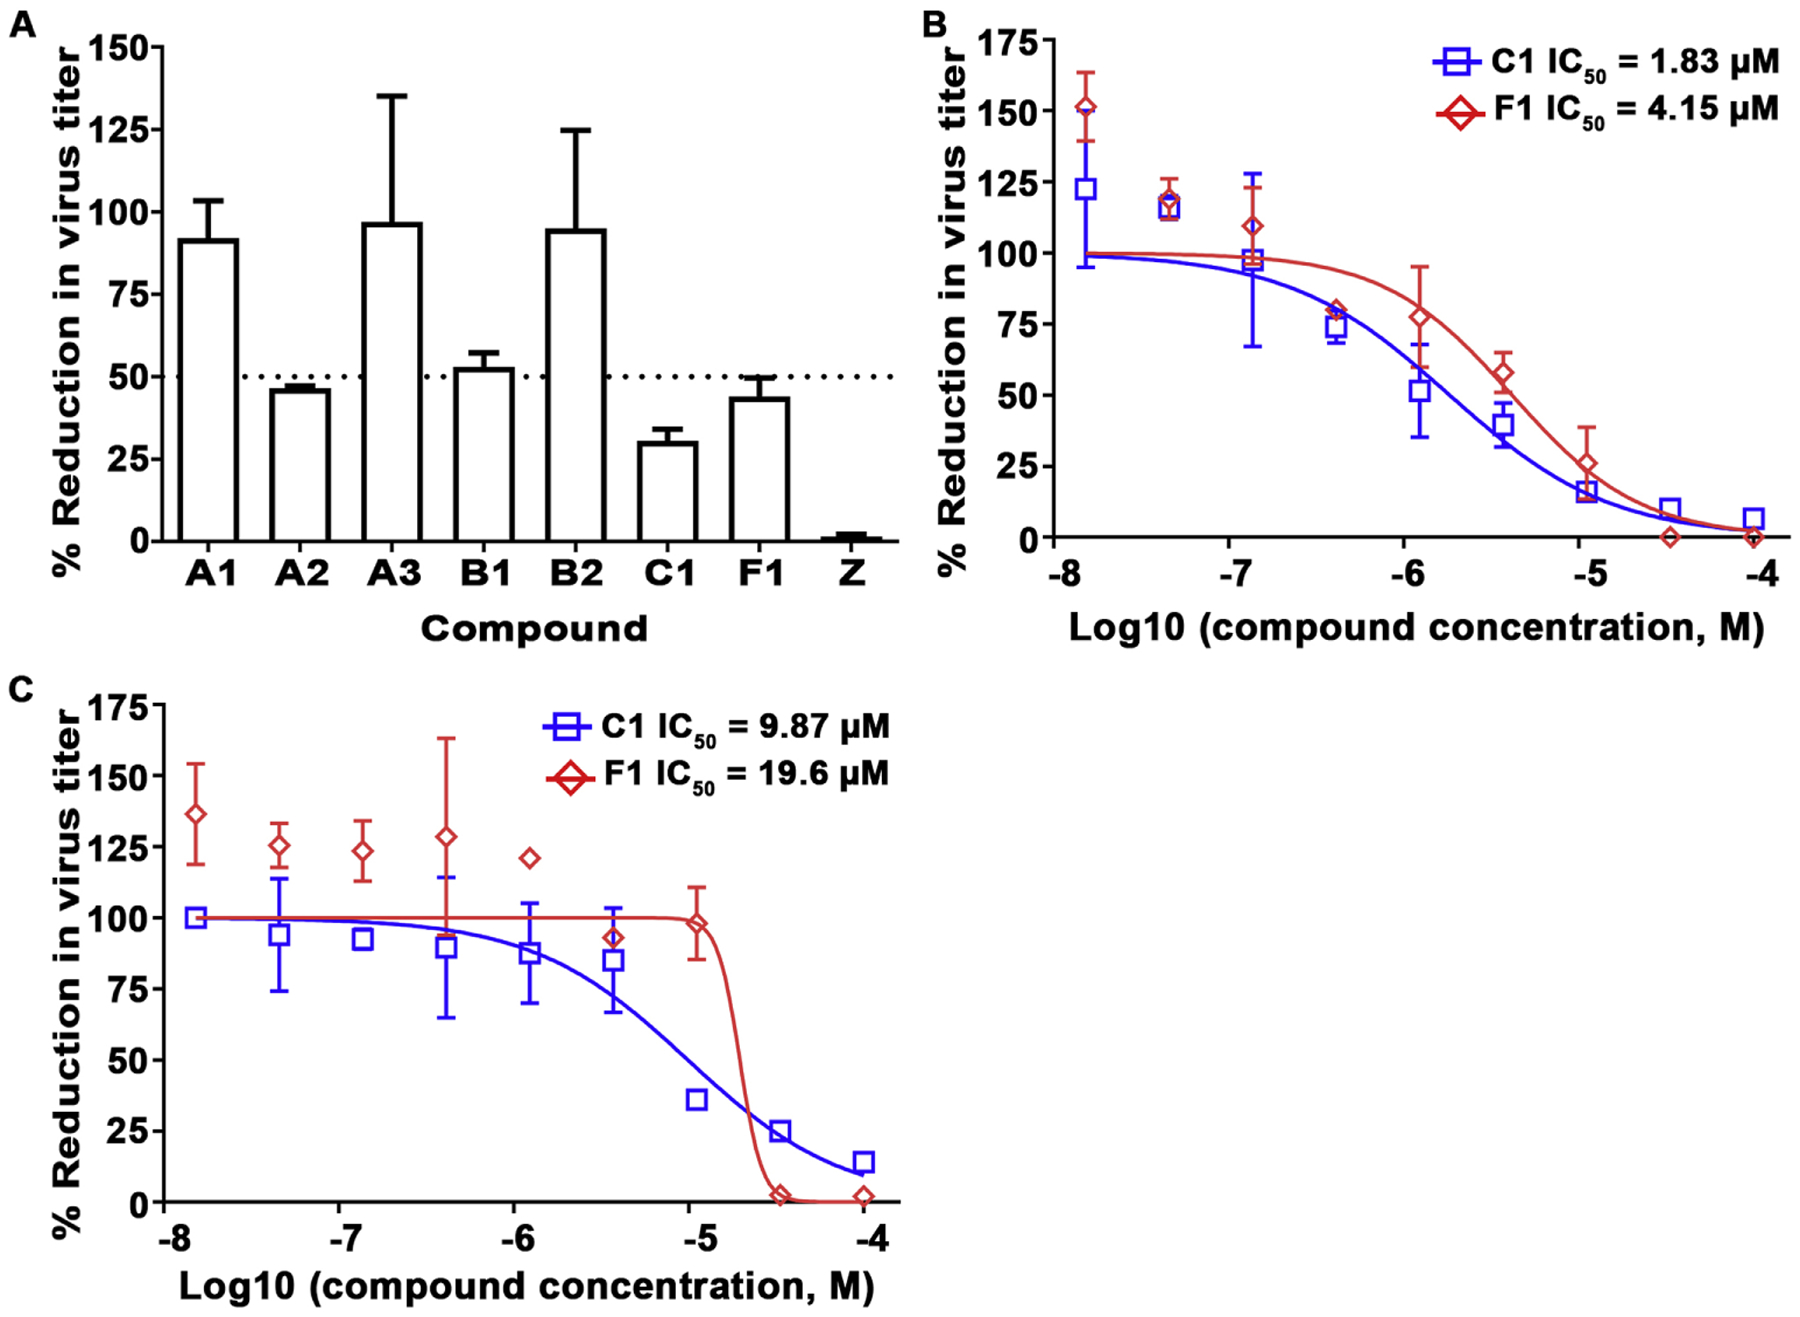
Fig. 8.

Inhibition of NiV-B and HeV replication by virus titer reduction assay. A) Compounds at 11.1 μM were first added to pre-seeded Vero 76 cells in a 96-well plate, followed by NiV-B infection at MOI of 0.01. Viral supernatants were collected 48 hpi and titrated by plaque assay to determine infectious virus titer. Values represent means and standard deviations indicating percent reduction in virus titer relative to the DMSO control (% Reduction in virus titer). The graph is representative of an independent experiment performed in duplicate (mean ± SD). The black dashed line represents 50% infection. Compounds C1 (blue square) and F1 (red diamond) were evaluated using NiV-B (B) or HeV (C) by virus titer reduction assay as in (A) at MOI of 0.01 by dose-response titration (15 nM to 100 μM; 1% DMSO). The data represent mean ± SD from a single experiment performed in duplicate.
