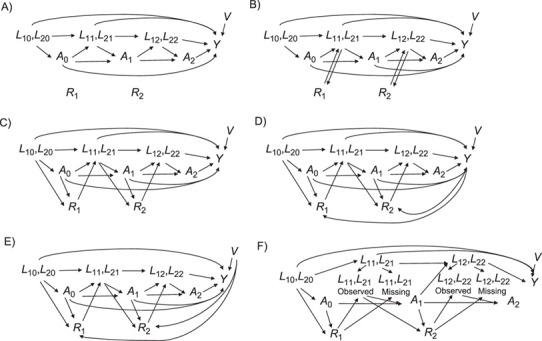
Figure 1.

Causal graphs representing several possible scenarios for missing values. At each time point, L1 and L2 are the 2 time-varying confounders, A is the time-varying treatment, Y is the outcome, V is an independent risk factor, and R is the missingness indicator. The diagrams represent scenarios in which missingness occurs completely at random (MCAR) (A); occurs when there has been no change since the previous measurement (constant) (B); occurs at random given the confounders and treatment (MAR|A, L) (C); occurs at random given the confounders, treatment, and outcome (MAR|A, L, Y) (D); occurs at random given the confounders, treatment, and an independent risk factor (E); and depends on the treatment and confounders but the association between the missing value and the subsequent treatment allocation no longer exists (differential) (F). Under the panel F scenario, the confounder only contributes to the treatment allocation decision when it is observed. MAR, missing at random; MCAR, missing completely at random.
