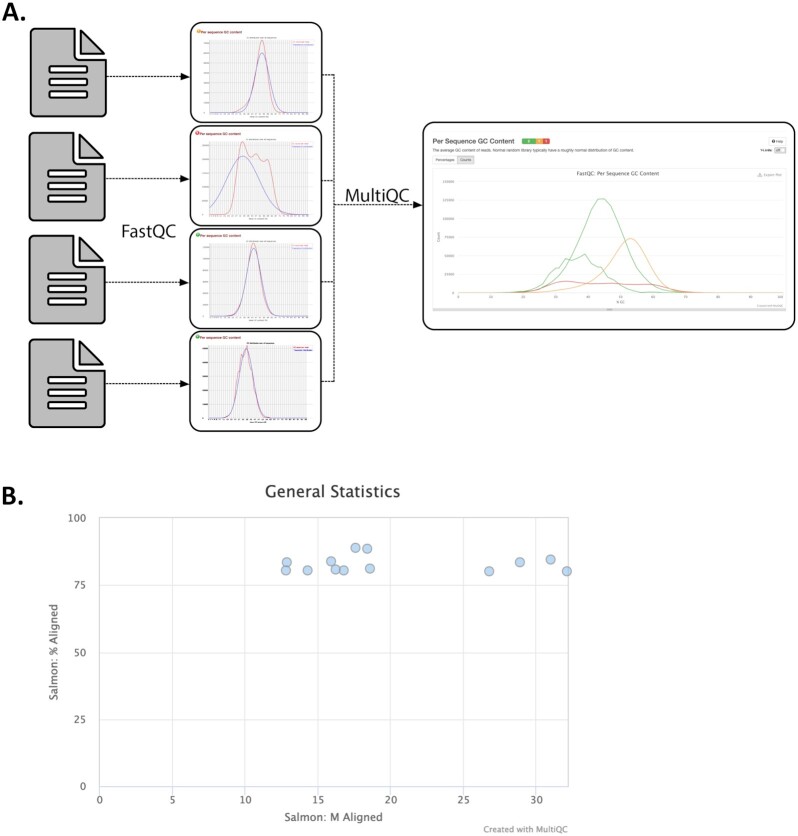
Figure 9:
Visualizations produced by MultiQC. MultiQC finds and automatically parses log files from other tools and generates a combined report and parsed data tables that include all samples. MultiQC currently supports 88 tools. A. MultiQC summary of FastQC Per Sequence GC Content for 1,905 metagenome samples. FastQC provides quality control measurements and visualizations for raw sequencing data from a single sample and is a near-universal first step in sequencing data analysis because of the insights that it provides [110, 111]. FastQC measures and summarizes 10 quality metrics and provides recommendations for whether an individual sample is within an acceptable quality range. Not all metrics readily apply to all sequencing data types. For example, while multiple GC peaks might be concerning in whole-genome sequencing of a bacterial isolate, we would expect a non-normal distribution for some metagenome samples that contain organisms with diverse GC content. Samples like this can be seen in red in this figure. B. MultiQC summary of Salmon quant reads mapped per sample for RNA-seq samples [112]. In this figure, we see that MultiQC summarizes the number of reads mapped and percent of reads mapped, 2 values that are reported in the Salmon log files.

