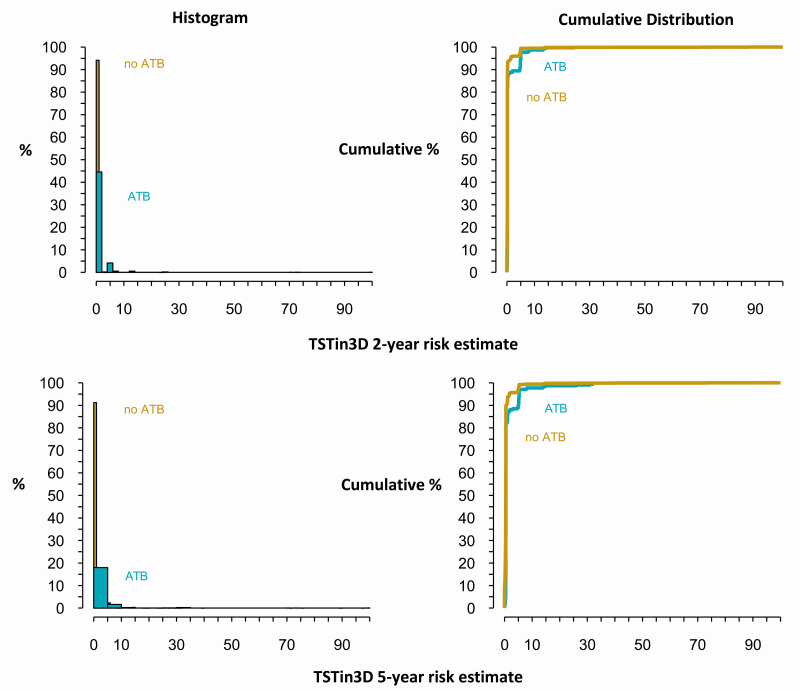
Figure 2.
Distribution of the TSTin3D 2- and 5-year risk estimates. The histogram shows that the majority of individuals (>90%) who did not develop ATB within 2 or 5 years had lower TSTin3D risk estimates (mostly zero). On the other hand, many of those who developed ATB had nonzero risk estimates. In people who developed ATB, those in the 90th percentile of TSTin3D risk had calculated 2-year and 5-year ATB risks of 4.7 and 5.2, respectively (cumulative distribution). In contrast, of people who did not have ATB, those in the 90th percentile of TSTin3D risk had calculated 2-year and 5-year risks of 0.23 and 0.86, respectively (cumulative distribution). Abbreviations: ATB, active tuberculosis; TSTin3D, Tuberculin Skin Test/Interferon Gamma Release Assay Interpreter V3.0.

