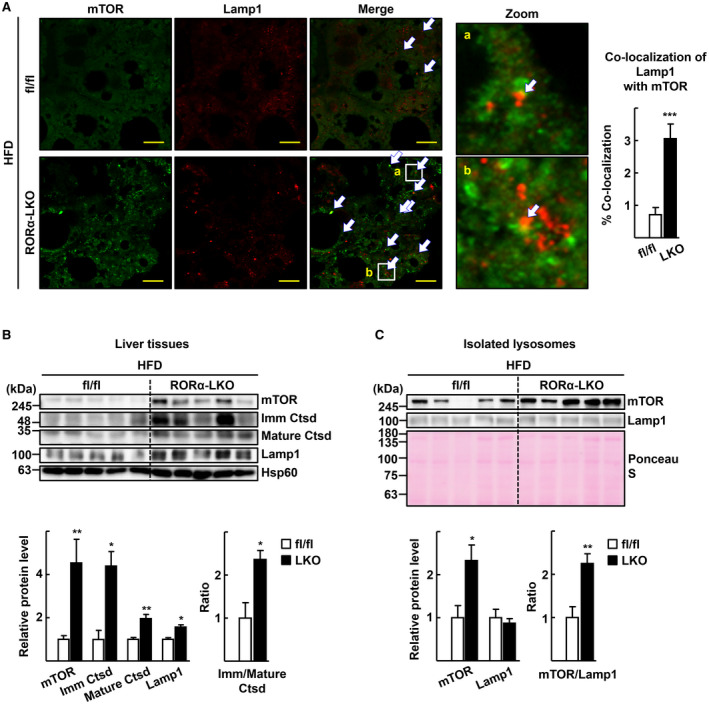
FIG. 2.

Deletion of RORα results in dysfunction of lysosomes in the liver. Six week‐old RORαfl/fl (fl/fl) and RORα‐LKO (LKO) mice were fed with HFD for 12 weeks. (A) Mouse liver tissues were subjected to immunostaining for mTOR (green) and Lamp1 (red) and examined by confocal microscopy. Representative images are shown. Arrows indicate co‐localization of mTOR with Lamp1. Percentage of co‐localization was determined using the JACoP plugin of ImageJ software in three different sections for each liver tissue. Scale bar: 10 μm. ***P < 0.001 versus fl/fl (n = 4). (B) Tissue extracts from mouse liver were subjected to western blotting to analyze expression level of proteins. Densitometry was performed using ImageJ software and normalized to that of Hsp60. The numbers represent the relative protein level of RORα‐LKO livers when the level of fl/fl livers was considered as 1. The ratio of Immature (Imm) Ctsd/Mature Ctsd was determined using the protein levels of two different forms of Ctsd that were normalized with Hsp60, and the ratio of fl/fl livers was considered as 1. *P < 0.05 and **P < 0.01 versus fl/fl (n = 5). (C) Lysosomal fractions were prepared from liver tissues of HFD‐fed RORαfl/fl (fl/fl) and RORα‐LKO (LKO) mice. The indicated proteins were analyzed by western blotting. Membrane was stained with Ponceau S as a loading control. Band intensities of each protein were quantified using ImageJ software and normalized to that of Ponceau S. The numbers represent the relative protein levels of RORα‐LKO livers when the level of fl/fl livers was considered as 1. The ratio of mTOR/Lamp1 was determined using the protein level of each protein, and the ratio of fl/fl livers was considered as 1. *P < 0.05 and **P < 0.01 versus fl/fl (n = 5).
