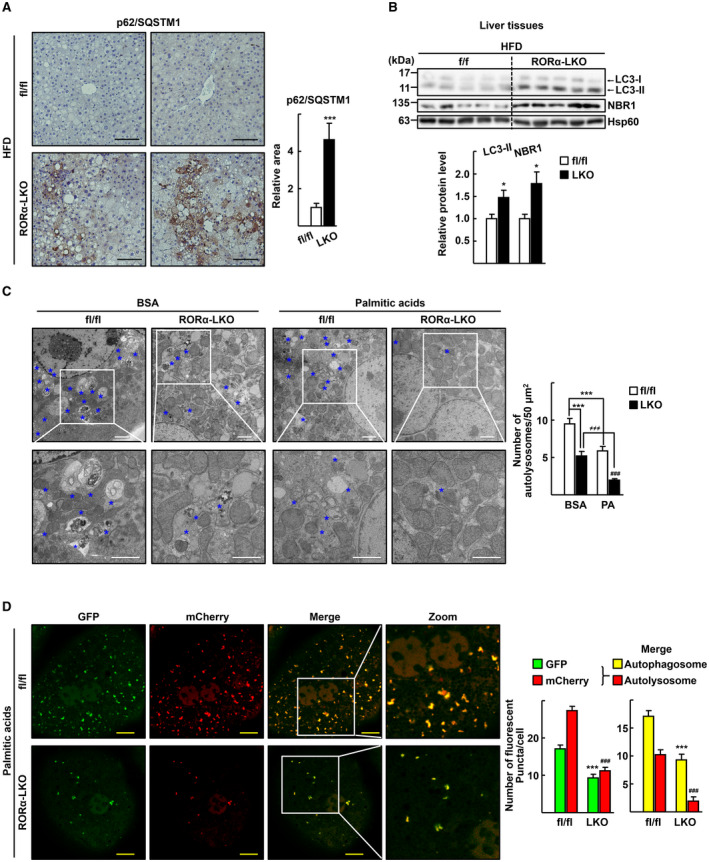
FIG. 3.

Depletion of RORα impairs autophagic flux in the hepatocytes. (A) Expression of p62/SQSTM1 in the liver sections of the HFD‐fed RORαfl/fl (fl/fl) and RORα‐LKO (LKO) mice was visualized by IHC. Representative images are presented. The relative area of p62/SQSTM1 staining was quantified in at least two images from a liver tissue using ImageJ software. Scale bar: 100 μm. ***P < 0.001 versus fl/fl (n = 5). (B) Tissue extracts were prepared from liver of HFD‐fed RORαfl/fl (fl/fl) and RORα‐LKO (LKO) mice. Expression of the indicated proteins was analyzed by western blotting. Intensity of each protein band was quantified using ImageJ software and normalized to that of Hsp60. The numbers represent the relative protein level of RORα‐LKO livers when the level of fl/fl livers was considered as 1. *P < 0.05 versus fl/fl (n = 5). (C) Hepatocytes obtained from RORαfl/fl (fl/fl) or RORα‐LKO (LKO) were exposed to 0.5 mM palmitic acid conjugated with BSA or BSA for 1 hour, and then fixed in 2.5% glutaraldehyde. Representative EM images are shown. Blue stars indicate autolysosomes. The number of autolysosomes was counted in at least 20 cells. Scale bar: 2 μm. ***P < 0.001 versus BSA‐treated fl/fl; ### P < 0.001 versus palmitic acid‐BSA treated fl/fl; and ≠≠≠ P < 0.001 versus BSA‐treated LKO. (D) Hepatocytes obtained from RORαfl/fl (fl/fl) or RORα‐LKO (LKO) were transduced by Ad‐mCherry‐GFP‐LC3. After 18 hours, cells were treated with 0.5 mM palmitic acid conjugated with BSA for 1 hour. The autophagosomes (yellow in merge) and autolysosomes (red in merge) in at least 100 cells were counted. Scale bar: 10 μm. ***P < 0.001 versus GFP or autophagosome of fl/fl and ### P < 0.001 versus mCherry or autolysosome of fl/fl.
