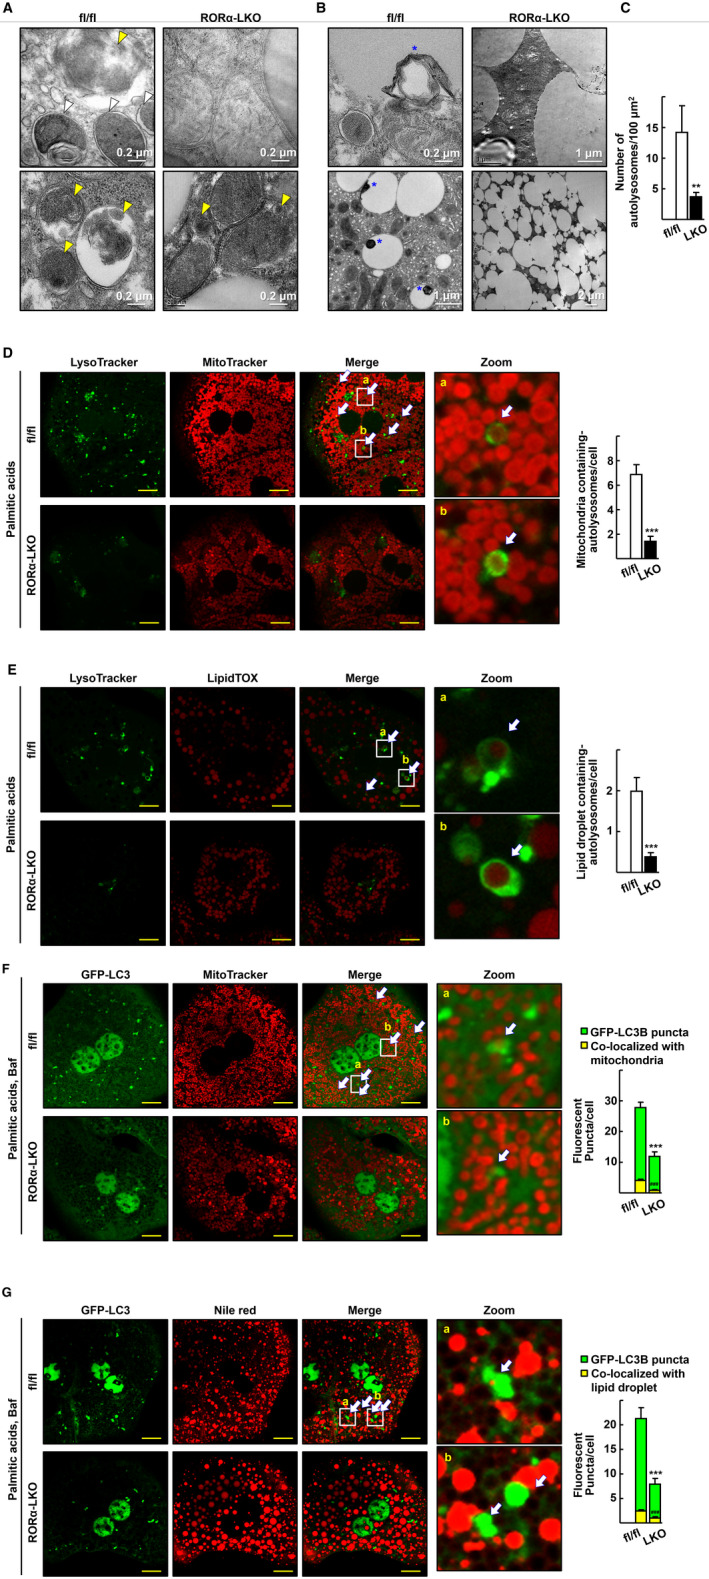
FIG. 4.

Mitophagy and lipophagy are impaired in the liver of RORα‐LKO mice. (A,B) Representative EM images of the liver sections from the HFD‐fed RORαfl/fl (fl/fl) and RORα‐LKO (LKO) mice. (A) White arrowheads indicate autophagosomes that contain clearly discernible mitochondria, and yellow arrowheads indicate autolysosomes that contain partially disrupted materials. (B) Blue stars indicate lipophagy, lipid droplets with multimembrane structures or a dug in lipid droplet. (C) The number of autolysosomes was counted in five different liver sections of each mouse. **P < 0.01 versus fl/fl (n = 4). (D) Hepatocytes obtained from the RORαfl/fl (fl/fl) and RORα‐LKO (LKO) mice were treated with 0.5 mM palmitic acids conjugated with BSA for 1 hour, stained with MitoTracker Red CMXRos and LysoTracker Green DND‐26, and subjected to confocal microscopy. The number of autolysosomes containing mitochondria, as indicated by white arrows, was counted in at least 100 cells. Scale bar: 10 μm. ***P < 0.001 versus fl/fl. (E) Hepatocytes obtained from the RORαfl/fl (fl/fl) and RORα‐LKO (LKO) mice were treated with 0.5 mM palmitic acids conjugated with BSA for 6 hours and stained with LipidTOX Red and LysoTracker Green DND‐26. The number of autolysosomes containing lipid droplets, as indicated by white arrows, was counted in at least 100 cells. Scale bar: 10 μm. ***P < 0.001 versus fl/fl. (F) Hepatocytes of RORαfl/fl (fl/fl) and RORα‐LKO (LKO) mice were transduced by Ad‐GFP‐LC3. After 18 hours, cells were exposed to 0.5 mM palmitic acids conjugated with BSA, and 30 nM bafilomycin A1 (Baf) for 1 hour and then stained using MitoTracker Red CMXRos for confocal microscopy. The number of mitochondria wrapped with LC3 puncta, as indicated by white arrows, was counted in at least 100 cells. Scale bar: 10 μm. ***,### P < 0.001 versus GFP‐LC3 puncta and puncta with mitochondria, respectively, in hepatocytes of fl/fl. (G) The virus‐infused hepatocytes of RORαfl/fl (fl/fl) and RORα‐LKO (LKO) mice were treated with 0.5 mM palmitic acid conjugated with BSA for 6 hours, and 30 nM bafilomycin A1 for 1 hour before examination of lipophagosome. Hepatocytes were then stained using Nile red for visualization of lipid droplets. The number of lipids wrapped with LC3 puncta, as indicated by white arrows, was counted in at least 100 cells. Scale bar: 10 μm. ***,### P < 0.001 versus GFP‐LC3 puncta and puncta with lipids, respectively, in hepatocytes of fl/fl.
