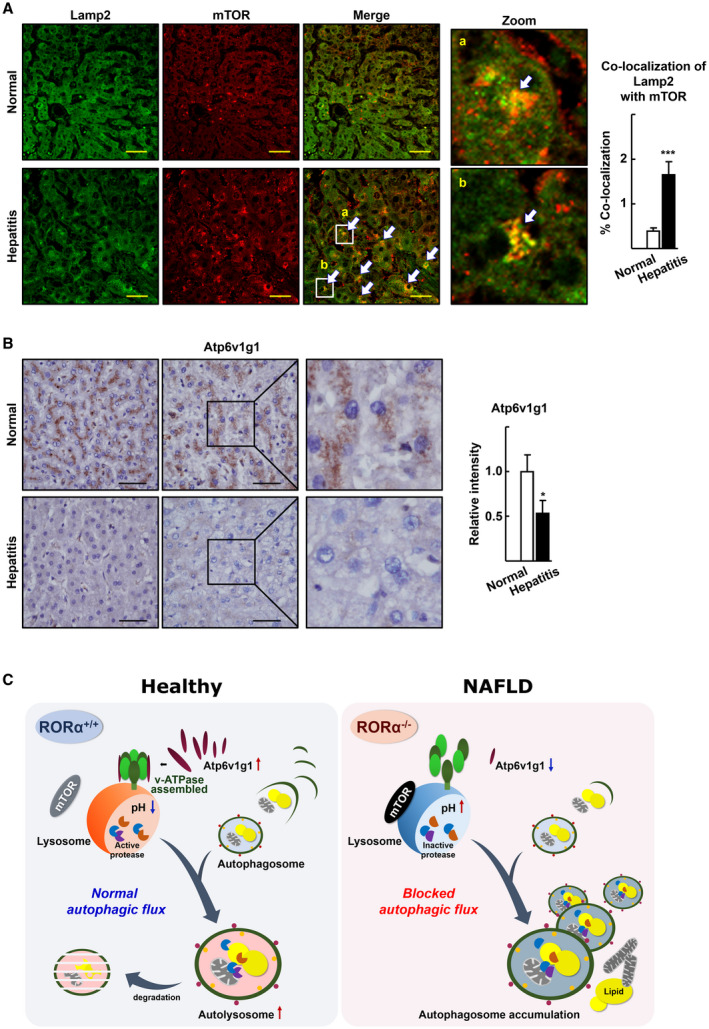
FIG. 7.

mTOR translocation to lysosomes and decreased expression of Atp6v1g1 in the livers of patients with hepatitis. (A) Liver specimens of patients with hepatitis were examined for the expression pattern of mTOR (red) and Lamp2 (green) using IF and subsequent confocal microscopy. Representative images are shown. Arrows indicate co‐localization of mTOR with Lamp1. Percentage of co‐localization was determined using the JACoP plugin of ImageJ software in two different images for each tissue specimen. Scale bar: 50 μm. ***P < 0.001 versus normal (n = 12 for normal, n = 9 for hepatitis). (B) Expression of Atp6v1g1 in the liver specimens of patients with hepatitis was visualized by IHC. Representative images are presented. The intensity of Atp6v1g1 staining was quantified in two images for a liver specimen using ImageJ software. Scale bar: 50 μm. *P < 0.05 versus normal (n = 12 for normal, n = 9 for hepatitis). (C) Schematic model for gain and loss of function of RORα in lysosomal acidification and autophagic flux.
