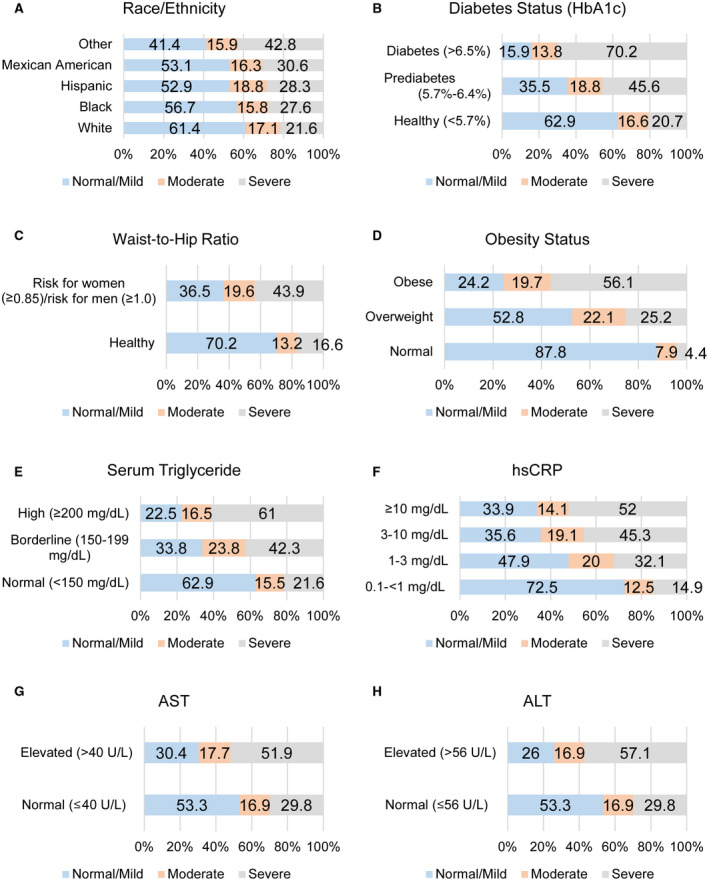
FIG. 1.

Prevalence of HS by risk factor. The prevalence of normal/mild (S0,S1), moderate (S2), and severe (S3) HS are shown for (A) race/ethnicity, (B) level of HbA1c, (C) waist‐to‐hip ratio, (D) level of BMI, (E) level of triglycerides, (F) level of hsCRP, (G) normal and elevated levels of AST, and (H) normal and elevated levels of ALT. The numbers on the bars indicate the prevalence.
