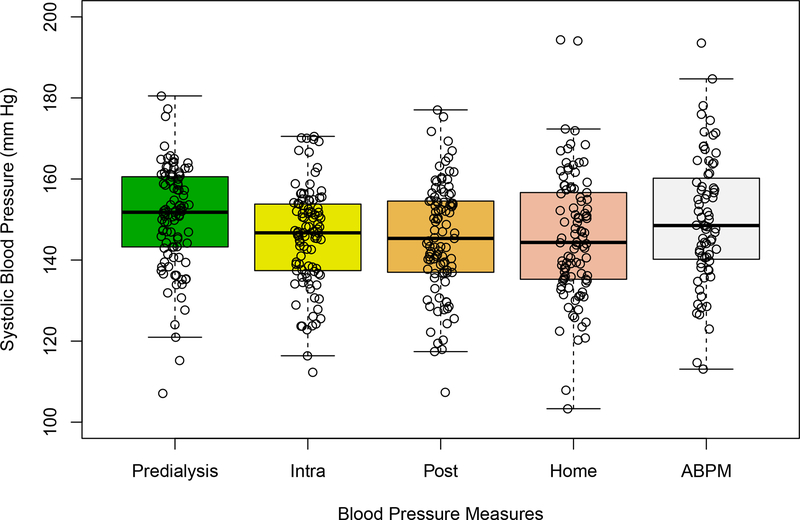
Figure 1. Distributions of Standardized Predialysis, Home, Postdialysis, and Average Intradialysis Systolic Blood Pressures.
Figure 1. Boxplots with jitter show the distributions of the midweek pre-(standardized), post-, and intradialysis blood pressure, next day home blood pressure readings averaged over all dialysis sessions over the course of the year in each of 97 patients, and all possible ABPM over the year in each of 72 patients. Each data point represents one participant.

