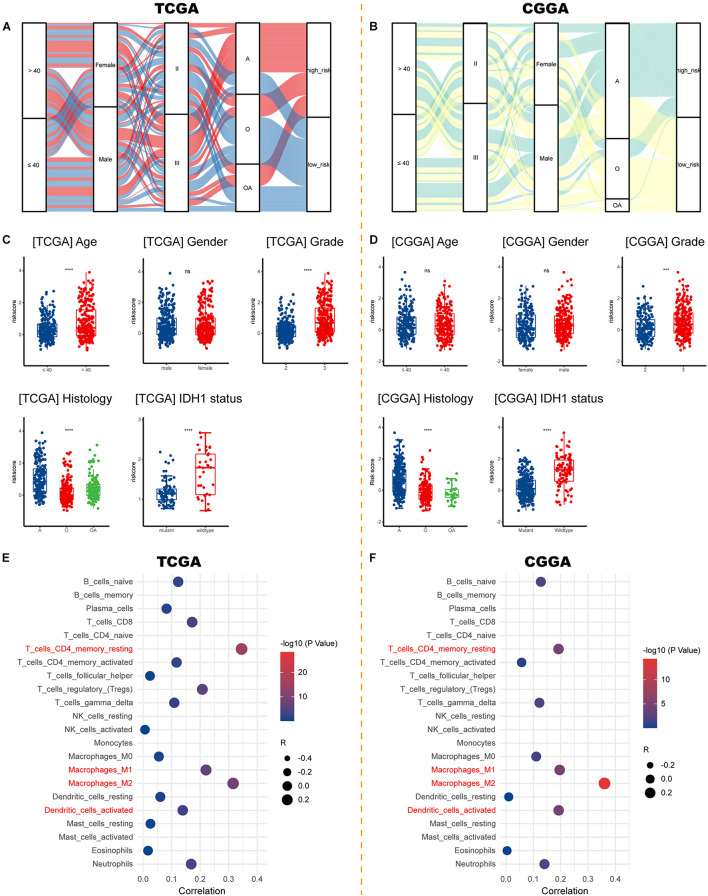
FIGURE 7.
Correlations between risk signature and clinicopathological characteristics. (A,B) Sankey diagrams showing the distribution of risk score and clinicopathologic characteristics in the TCGA and CGGA cohorts. (C,D) The risk score in different subgroups stratified by age, gender, WHO grade, histological type, and IDH1 status in the TCGA and CGGA cohorts. (E,F) Correlations between risk score and immune infiltration in the TCGA and CGGA cohorts. ***p < 0.001, ****p < 0.0001, ns, not significant. A, astrocytoma; O, oligodendroglioma; OA, oligoastrocytoma; IDH1, isocitrate dehydrogenase 1.

