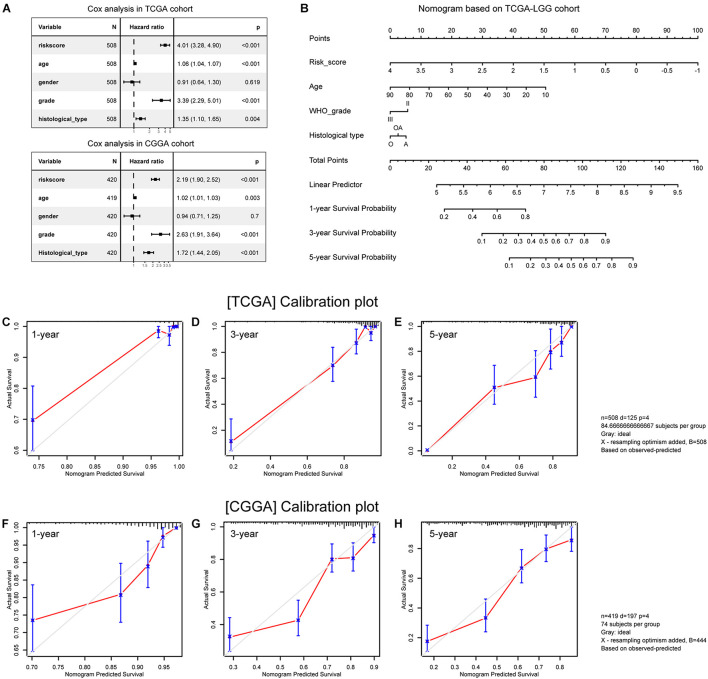
FIGURE 9.
Construction and validation of the nomogram. (A) Multivariate analysis results. (B) Nomogram based on risk score, age, WHO grade, and histological type. (C–E) Calibration plots of the nomogram for predicting the probability of OS at 1-, 3-, and 5-year in the TCGA cohort. (F–H) Calibration plots of the nomogram for predicting the probability of OS at 1-, 3-, and 5-year in the CGGA cohort. A, astrocytoma; O, oligodendroglioma; OA, oligoastrocytoma.

