
Fig. 2.
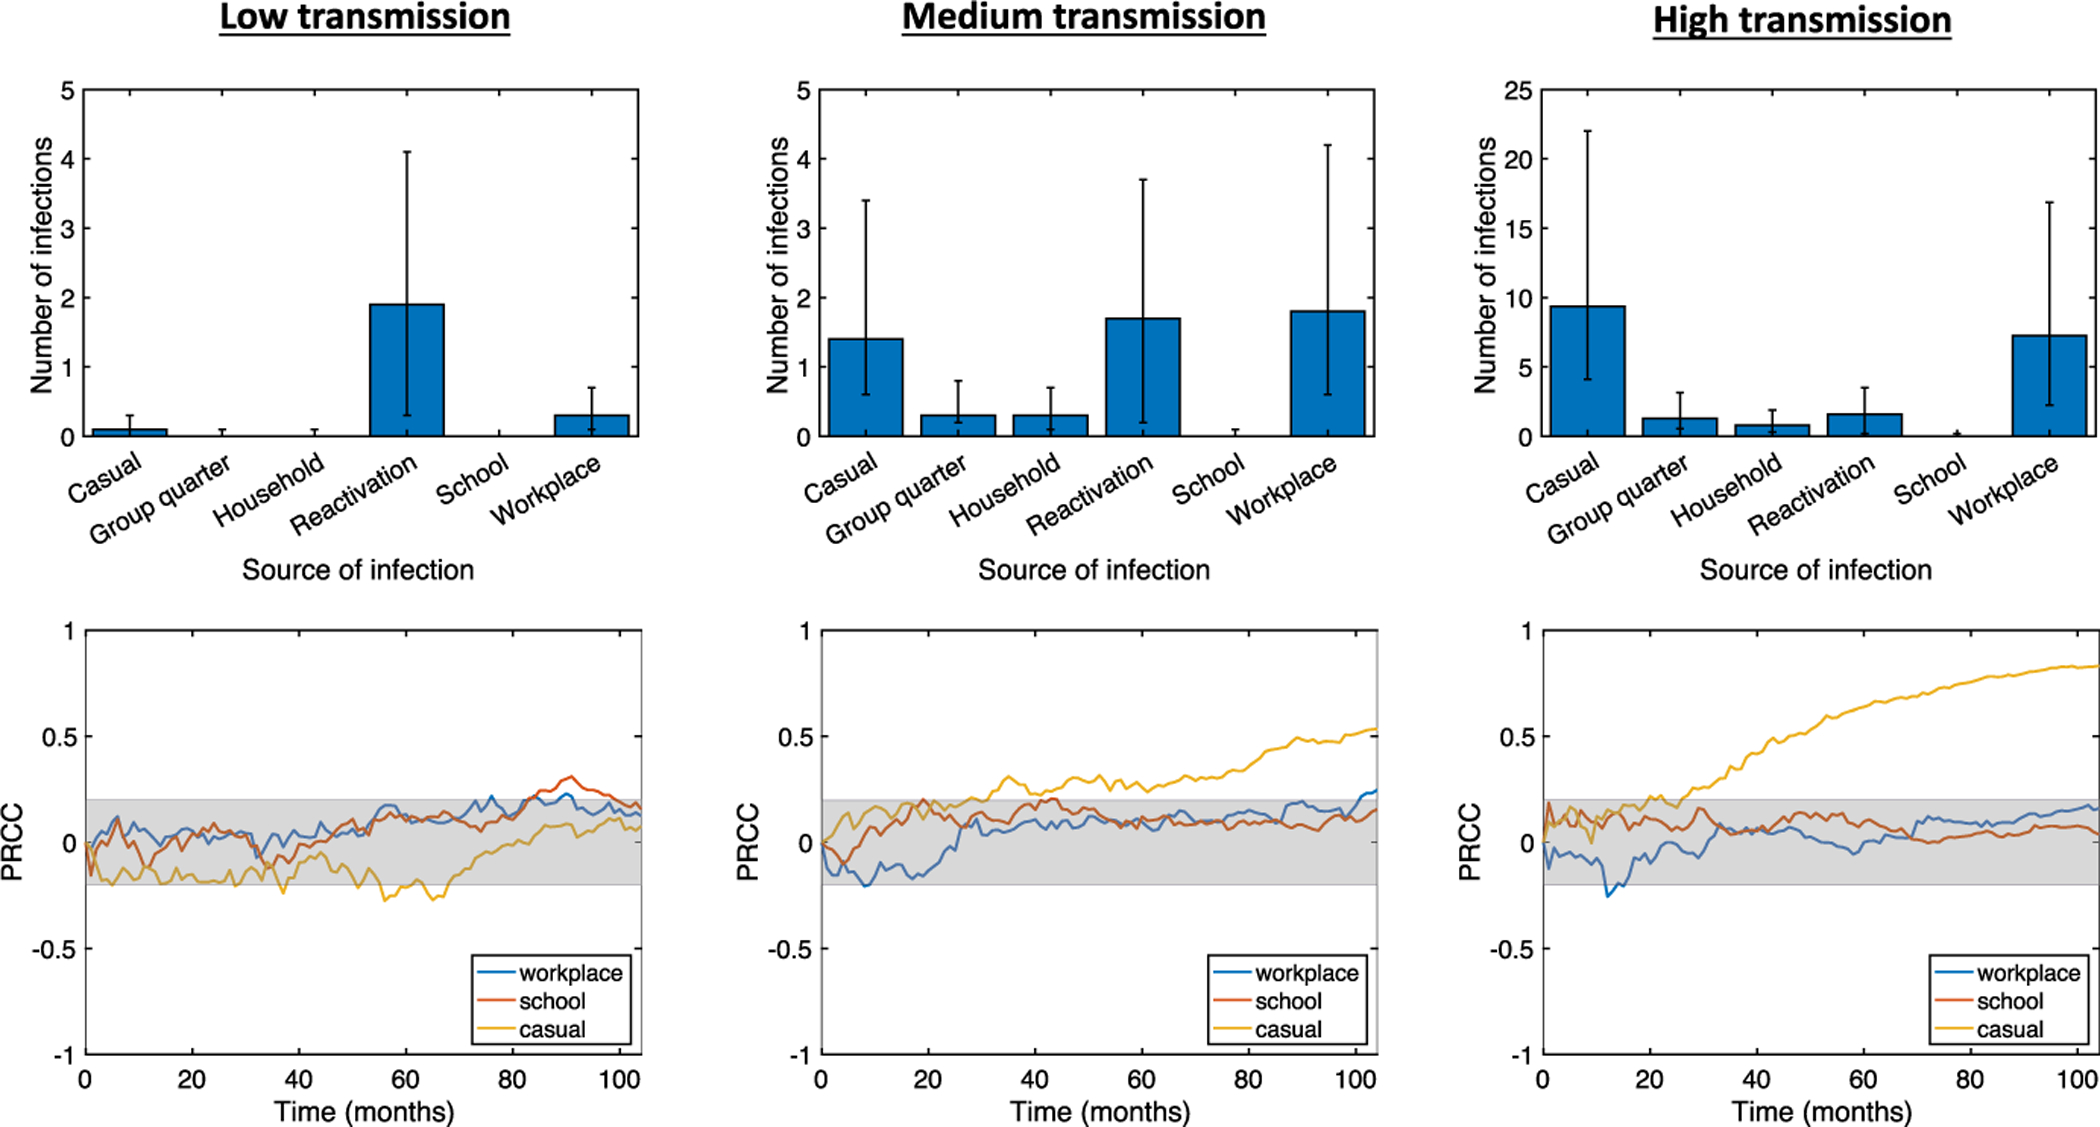
Top row: distribution of average number of active infections at t = 2 years by source of infection. Bar heights represent median values, while error bars represent the 25th and 75th percentiles. Bottom row: Sensitivities of active TB prevalence over time to different types of contact weights, measured via partial rank correlation coefficients (see Sect. 3.2, −1 ≤ PRCC ≤ 1). The gray shaded area indicates sensitivity values that are not statistically significant using a p value of 0.05. Contact weights were randomly sampled via LHS with low, medium, and high transmission rates; other model parameters were fixed at the values in Renardy and Kirschner (2019)