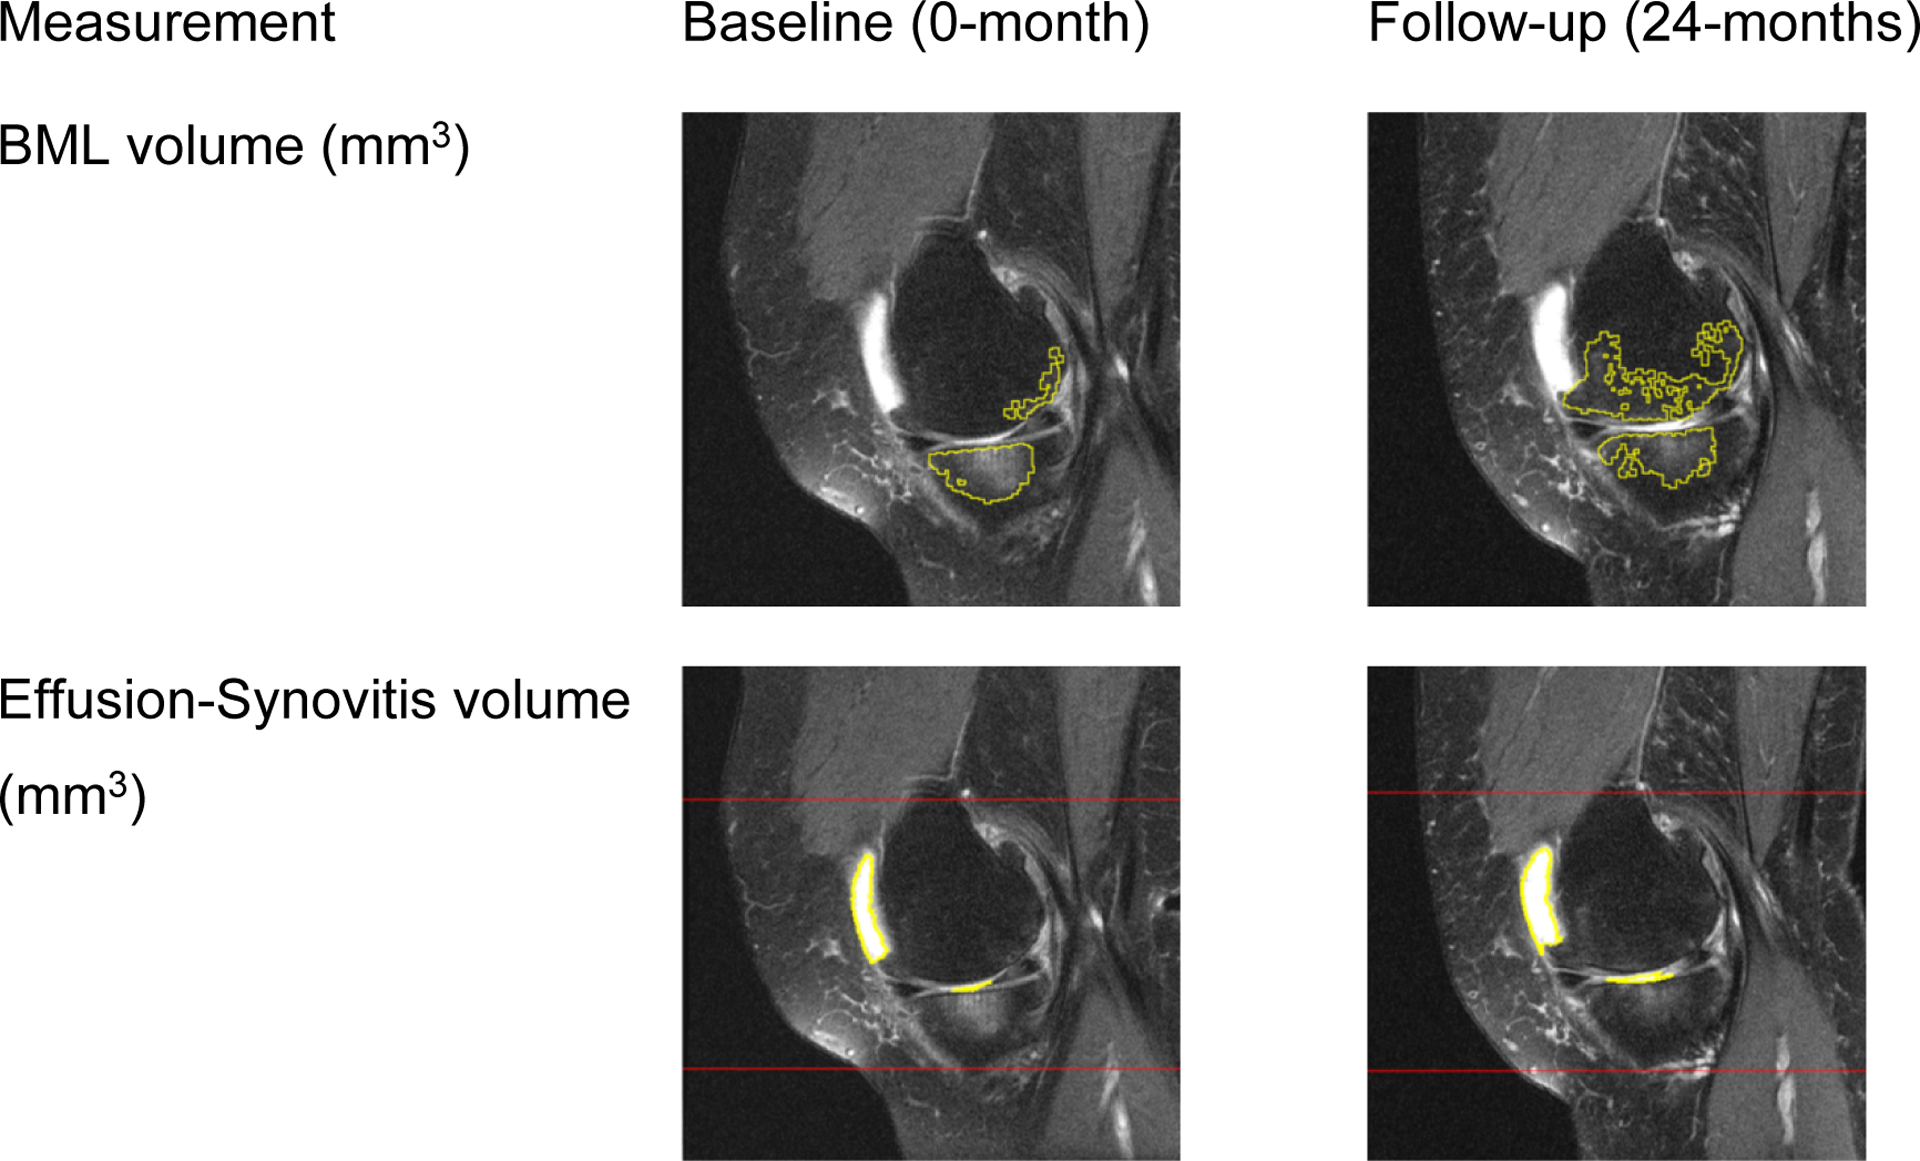
Figure 2: Measurement of medial tibiofemoral bone marrow lesion (BML) and whole knee effusion-synovitis on paired baseline and follow-up magnetic resonance (MR) images.

The top row are example MR images of a segmented BML (yellow lines). The bottom row are examples of effusion-synovitis segmentation (yellow lines). These measurements are components of the score based on BML+effusion-synovitis volume.
